
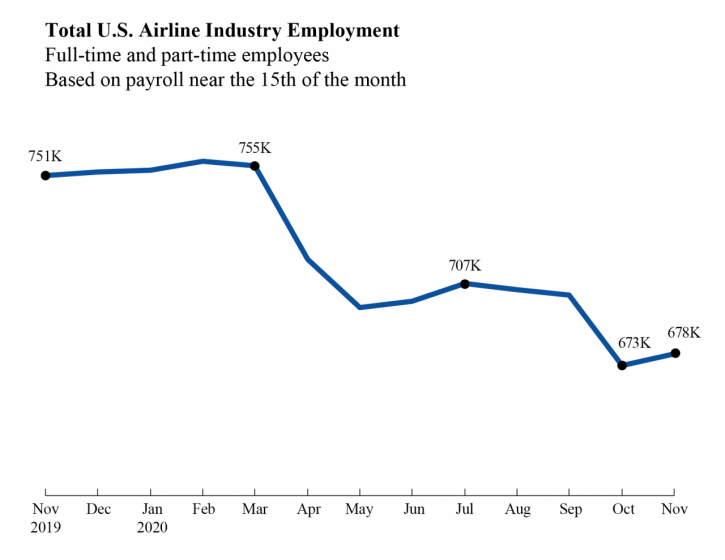
Mid-November Airline Employment Up 5,000 from Mid-October
U.S. airlines employed 678,287 workers in the middle of November 2020, 5,000 more than in mid-October 2020 but almost 77,000 fewer than in March 2020. The November numbers consist of 565,281 full-time and 113,006 part-time workers.
Regulations require airlines to report employment numbers to the Bureau of Transportation Statistics for employees who worked or received pay for any part of the pay period(s) ending nearest the 15th day of the month. Numbers include all paid employees but do not include employees not being paid.
Airlines receiving funds under CARES Act, implemented in April, were required to refrain from imposing involuntary furloughs on US-based employees or reducing employee pay or benefits through Sept. 30.
Total employment (full-time + part-time) by U.S. airlines (passenger + cargo carriers):
Major Airlines' Total Employees, March 2020 and November 2020
| Mar-20 | Nov-20 |
Change in
Employees
|
Percent
Change
|
|
|---|---|---|---|---|
|
Alaska
|
17,912
|
16,696
|
-1,216
|
-6.8
|
|
Allegiant
|
4,487
|
4,174
|
-313
|
-7.0
|
|
American
|
109,108
|
90,374
|
-18,734
|
-17.2
|
|
Atlas
|
3,121
|
3,455
|
334
|
10.7
|
|
Delta
|
89,980
|
62,278
|
-27,702
|
-30.8
|
|
Envoy
|
16,781
|
14,633
|
-2,148
|
-12.8
|
|
Federal Express
|
245,010
|
266,766
|
21,756
|
8.9
|
|
Frontier
|
5,181
|
5,021
|
-160
|
-3.1
|
|
Hawaiian
|
7,492
|
5,043
|
-2,449
|
-32.7
|
|
JetBlue
|
21,546
|
19,114
|
-2,432
|
-11.3
|
|
Kalitta
|
2,013
|
2,192
|
179
|
8.9
|
|
Polar Air Cargo
|
226
|
233
|
7
|
3.1
|
|
Republic
|
6,519
|
5,789
|
-730
|
-11.2
|
|
SkyWest
|
20,544
|
19,194
|
-1,350
|
-6.6
|
|
Southwest
|
62,081
|
57,954
|
-4,127
|
-6.6
|
|
Spirit
|
9,213
|
8,911
|
-302
|
-3.3
|
|
United
|
91,563
|
62,282
|
-29,281
|
-32.0
|
|
United Parcel Service
|
6,279
|
6,464
|
185
|
2.9
|
| Major Airline Total | 719,056 | 650,573 | -68,483 | -9.5 |
Additional individual airline numbers are available on the BTS airline employment web page. The web page provides full-time and part-time employment numbers by carrier by month from 1990 through November 2020.
Reports are from all U.S. airlines including scheduled passenger, charter and cargo that meet the reporting standard. Airlines that operate at least one aircraft that has more than 60 seats or the capacity to carry a payload of passengers, cargo and fuel weighing more than 18,000 pounds must report monthly employment statistics.
The next web update for full-time and part-time employment is scheduled for Feb. 9. The BTS press release on full-time equivalent employment for scheduled passenger airlines through October, with historic comparisons and summary tables will be issued Jan. 14.
-END-