
Post-CARES Act: U.S. Passenger Airlines Drop Nearly 37,000 Jobs in October 2020 from September
Airlines receiving funds under the CARES Act were prohibited from layoffs or furloughs until Sept. 30. The 22 U.S. scheduled passenger airlines employed 9.1% fewer full-time equivalents (FTEs) in mid-October 2020 than in mid-September 2020:
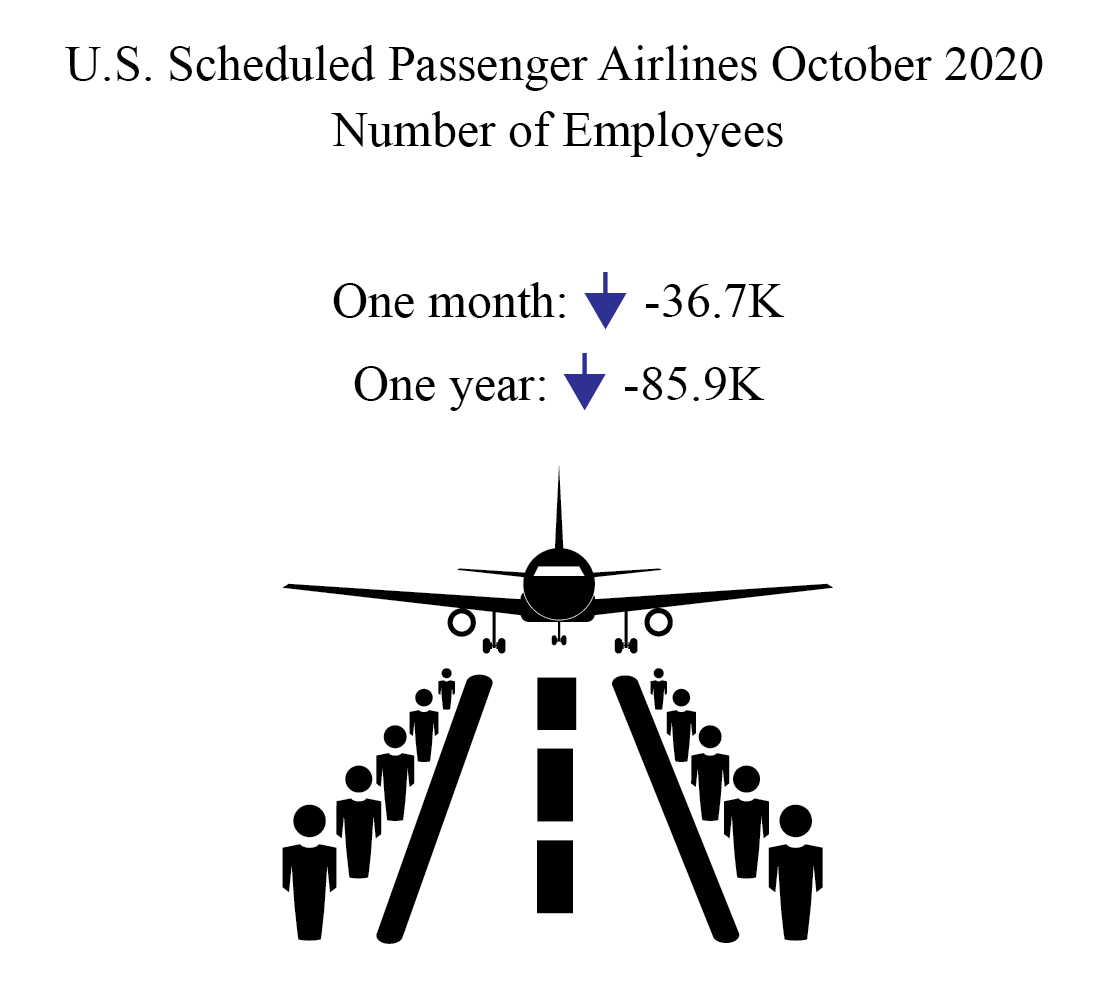
- Mid-October’s total number of FTEs (368,162) was down 36,707 from mid-September 2020 (404,869 FTEs) and 91,871 from mid-March 2020. October was the lowest FTE total for any month in Bureau of Transportation Statistics (BTS) records dating from January 1990. The previous low was April 2010 (376,663 FTEs).
- Mid-October’s FTEs declined nearly 86,000, an 18.9% drop from mid-October 2019 (454,070 FTEs).
Regulations require U.S. airlines to report employment numbers for employees who worked or received pay for any part of the pay period(s) ending nearest the 15th day of the month. U.S. airline employment reports are filed monthly with BTS. See the tables that accompany this release on the BTS website for detailed data since 2015 (Tables 1-15) and industry summary monthly data since 1990. New tables show changes from March through October (Tables A total, 9A network, 12A low-cost, 15A regional on the BTS website).
Employees at U.S. Scheduled Passenger Airlines Month of October, 1990-2020
| October FTEs in thousands (000) | 1 | |
|---|---|---|
| 1990 | 461.2 | 2 |
| 1991 | 429.7 | 3 |
| 1992 | 446.1 | 4 |
| 1993 | 439.9 | 5 |
| 1994 | 425.4 | 6 |
| 1995 | 430.5 | 7 |
| 1996 | 440.9 | 8 |
| 1997 | 454.8 | 9 |
| 1998 | 477.3 | 10 |
| 1999 | 502.9 | 11 |
| 2000 | 527.6 | 12 |
| 2001 | 497.0 | 13 |
| 2002 | 471.9 | 14 |
| 2003 | 429.0 | 15 |
| 2004 | 439.2 | 16 |
| 2005 | 412.8 | 17 |
| 2006 | 402.9 | 18 |
| 2007 | 417.8 | 19 |
| 2008 | 394.2 | 20 |
| 2009 | 378.0 | 21 |
| 2010 | 379.2 | 22 |
| 2011 | 386.6 | 23 |
| 2012 | 382.3 | 24 |
| 2013 | 381.2 | 25 |
| 2014 | 384.7 | 26 |
| 2015 | 399.9 | 27 |
| 2016 | 416.0 | 28 |
| 2017 | 430.2 | 29 |
| 2018 | 442.7 | 30 |
| 2019 | 454.1 | 31 |
| 2020 | 368.2 | 32 |
| 33 |
FTE calculations count two part-time employees as one full-time employee.
Bureau of Transportation Statistics
All 23 scheduled service passenger airlines (mid-October)
- 368,162 FTEs
- Down 18.9% (85,908 FTEs) from October 2019 (454,070 FTEs)
- Down 11.5% (47,817 FTEs) from October 2016 (415,979 FTEs)
Four network airlines (mid-October)
- 217,516 FTEs, 59.1% of total scheduled passenger airline FTEs
- Down 24.7% (71,264 FTEs) from October 2019 (288,780 FTEs)
- Down 20.3% (55,271 FTEs) from October 2016 (272,787 FTEs)
- Down 12.8% (32,049 FTEs) from mid-September 2020 (249,565 FTEs)
- Down 25.3% (73,693 FTEs) from mid-March 2020 (291,209 FTEs)
Network airlines operate a significant portion of their flights using at least one hub where connections are made for flights to down-line destinations or spoke cities. Note that beginning with January 2018 data, Virgin America’s numbers are included with Alaska Airlines in the network category.
Five low-cost airlines (mid-October)
- 92,153 FTEs, 25.0% of total scheduled passenger airline FTEs
- Down 5.3% (5,129 FTEs) from October 2019 (97,282 FTEs)
- Up 8.4% (7,120 FTEs) from October 2016 (85,033 FTEs)
- Down 1.5% (1,431 FTEs) from mid-September 2020 (93,584 FTEs)
- Down 6.5% (6,378 FTEs) from mid-March 2020 (98,531 FTEs)
Low-cost airlines operate under a low-cost business model, with infrastructure and aircraft operating costs below the overall industry average.
10 regional airlines (mid-September)
- 50,293 FTEs, 13.7% of total scheduled passenger airline FTEs
- Down 15.9% (9,517 FTEs) from October 2019 (59,810 FTEs)
- Down 0.7% (344 FTEs) from October 2016 (50,637 FTEs)
- Down 5.8% (3,106 FTEs) from mid-September 2020 (53,399 FTEs)
- Down 17.6% (10,710 FTEs) from mid-March 2020 (61,003 FTEs)
Regional carriers typically provide service from small cities, using primarily regional jets to support the network carriers’ hub and spoke systems.
Top Employers by Group
- Network: American 85,064 FTEs
- Low-Cost: Southwest 57,063 FTEs
- Regional: SkyWest 16,837 FTEs
Four other airlines
Other carriers generally operate within specific niche markets. They are: Hawaiian Airlines, Sun Country Airlines, Silver Airlines and Eastern Airlines.
Reporting Notes
Airlines that operate at least one aircraft that has more than 60 seats or the capacity to carry a payload of passengers, cargo and fuel weighing more than 18,000 pounds must report monthly employment statistics.
Data are compiled from monthly reports filed with BTS by commercial air carriers as of Dec. 3. Additional airline employment data and previous releases can be found on the BTS website. BTS has scheduled release of October passenger airline employment data for Jan. 14.