
Second Quarter 2022 Average Air Fare Increases 22% from Second Quarter 2021
BTS 46-22
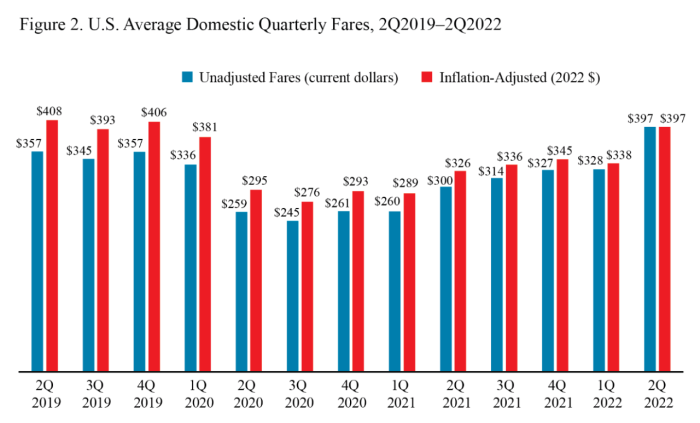
The average U.S. domestic air fare increased in the second quarter of 2022 to $397, up 17.4% from the first quarter 2022 inflation-adjusted fare of $338. Adjusted for inflation (constant 2022 dollars), the average 2Q 2022 air fare was up 34.6% from $295 in the first full quarter (Q2) of the pandemic in 2020 and down 2.1% from pre-pandemic Q4 2019 ($406). Adjusted for inflation, the second quarter 2022 fare is up 22.0% from the second quarter 2021 fare of $326.
In the second quarter 2022, passenger demand increased with U.S. airlines reporting 85.3 million originating passengers, up 641.74% from 11.5 million passengers in second quarter of 2020.
Itinerary Fares: Round-trips, but includes one-way tickets if no return is purchased.
Breakout of trip types: one-way, 41% ($284); round-trip, 59% ($498).
Fare calculations by BTS
*Based on a sample of approximately 10% of tickets sold.
Total ticket value: The price charged by airlines at time of ticket purchase.
Included: All fees and charges levied by an air carrier required for the passenger to board the aircraft. Also, additional taxes and fees levied by an outside entity at time of ticket purchase.
Not included: Fees for optional services, such as baggage fees, seat upgrades, and selecting an assigned seat on the aircraft.
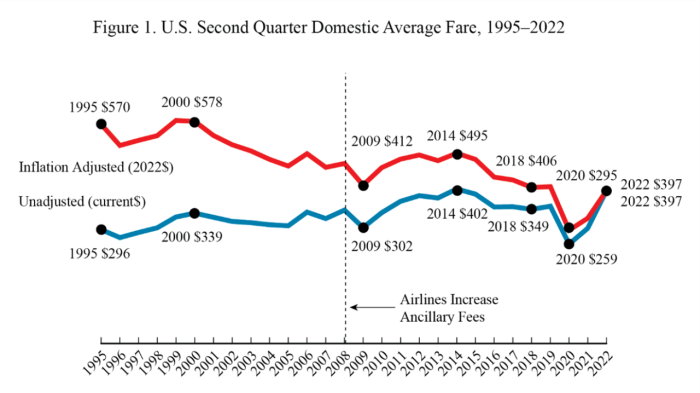
Inflation-Adjusted Average Air Fares
Second Quarter 2022 fare ($397):
Compared to all second quarters: Down 31.5% from the highest 2Q fare, $580 in 1999.
Compared to all quarters: Down 32.6% from the highest fare for any quarter, $590 in 1Q 1999.
Start of BTS records: Down 31.0% from 1Q 1995 ($576).
Recent high: Down 6.6% from 2Q 2017 ($425).
Recent low: Up 44.1% from 3Q 2020 ($276).
All-time low: Up 44.1% from the previous low 3Q 2020 ($276).
All-time second-quarter low: Up 34.6% from the previous low 2Q 2020 ($295).
Other Revenue: In recent years, airlines have increasingly obtained additional revenue from passenger fees, as well as from other sources. U.S. passenger airlines collected 71.1% of total operating revenue of $68.6 billion from passenger fares during the six months of 2022, down from 88.5% in 1990.
Unadjusted Average Air Fares
Second Quarter 2022 fare ($397):
Trend: Up 20.9% from 1Q 2022 ($328).
Compared to all second quarters: Down 1.3% from the highest 2Q fare, $402 in 2014.
Compared to all quarters: Down 1.3% from the highest fare for any quarter, $402 in 2Q 2014.
Start of BTS records: Up 33.8% from 1Q 1995 ($297) (compared to 93.9% consumer price increase).
Recent low: Up 62.3% from 3Q 2020 ($245).
Recent high: Up 10.5% from 4Q 2018 ($359).
All-time low: Up 62.3% from 3Q 2020 ($245).
All-time second-quarter low: Up 53.3% from 2Q 2020 ($259).
Fares by Airport
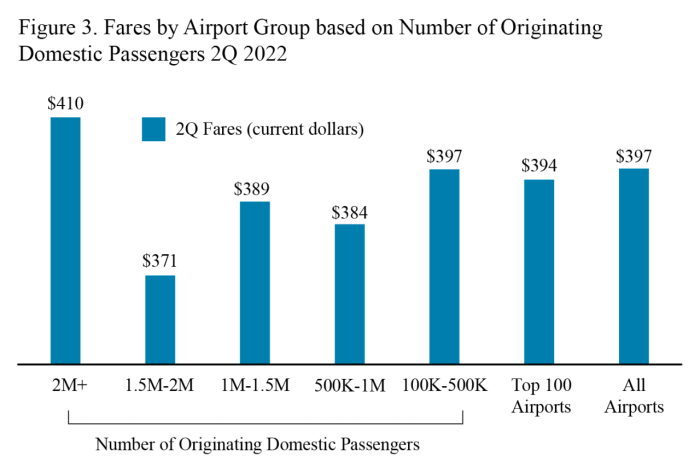
Fares by airport group:
Highest: 11 airports with 2+ million originating passengers ($410)
Lowest: 5 airports with 1.5-1.99 million originating passengers ($371)
Additional data: see Top 100 Airports or All Airports. Third Quarter 2022 average fare data will be released January 18, 2023.
Standard error: Results for average fares are based on the BTS Origin & Destination Survey, a 10% sample of airline tickets used during the quarter. Averages for airports with smaller samples may be less reliable. For Q2 2022 results based on all itinerary fares, the standard error is 0.30 and the median fare is $317.26. The 90% confidence interval ranges from $396.65 to $397.63. For results based on round-trip fares, the standard error is .39 and the median fare is $416.49. The 90% confidence interval ranges from $497.31 to $498.58. For results based on one-way fares, the standard error is .34 and the median fare is $225.41. The 90% confidence interval ranges from $282.95 to $284.08.