
Third Quarter 2020 Air Fare Drops to New Low as Passenger Numbers Decline
Release Number: BTS 07-21
The average U.S. domestic air fare declined in the third quarter of 2020 to $245, the lowest inflation-adjusted average quarterly air fare in Bureau of Transportation Statistics (BTS) records dating back to 1995. The previous low was $262 in the second quarter of 2020.
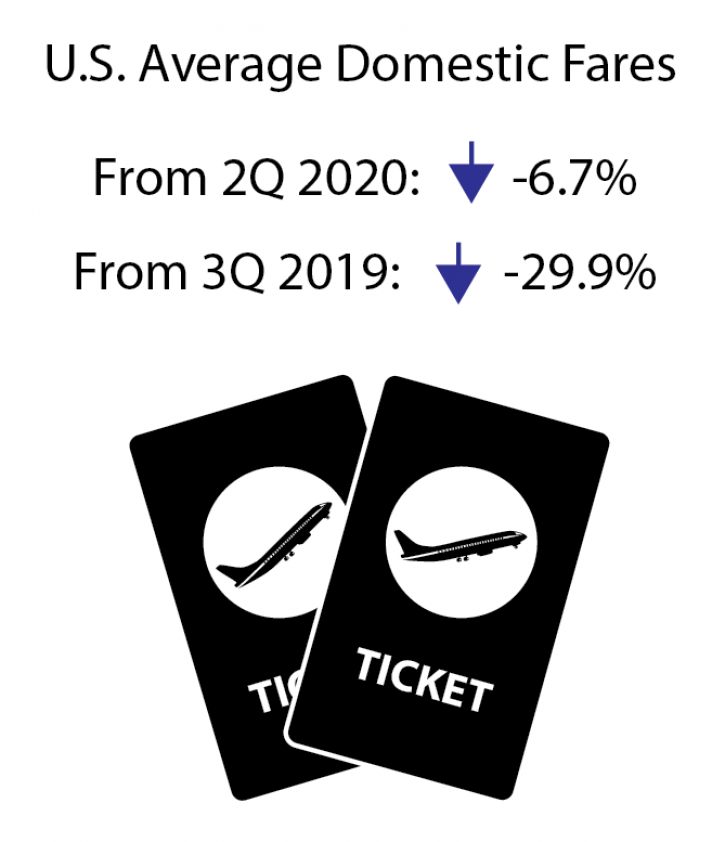
Adjusted for inflation (constant 2020 dollars) the average 3Q 2020 air fare was:
- Down 29.9% from 3Q 2019 ($349)
- Down 6.7% from 2Q 2020 ($262)
- Down 40.0% from 3Q 2015 ($408)
Air fares declined along with passenger demand. U.S. airlines reported 27 million originating passengers in the third quarter of 2020, down from 86 million passengers a year earlier.
The percent change is based on unrounded numbers. COVID-19 effects on travel were significant in the July-September reporting period.
Itinerary Fares: Round-trips, but includes one-way tickets if no return is purchased.
Breakout of trip types: one-way, 45% ($202); round-trip, 55% ($285).
Fare calculations by BTS
*Based on a random sample of approximately 10% of tickets sold.
Total ticket value: The price charged by airlines at time of ticket purchase.
Included: Additional taxes and fees levied by an outside entity at time of ticket purchase.
Not included: Fees for optional services, such as baggage fees.
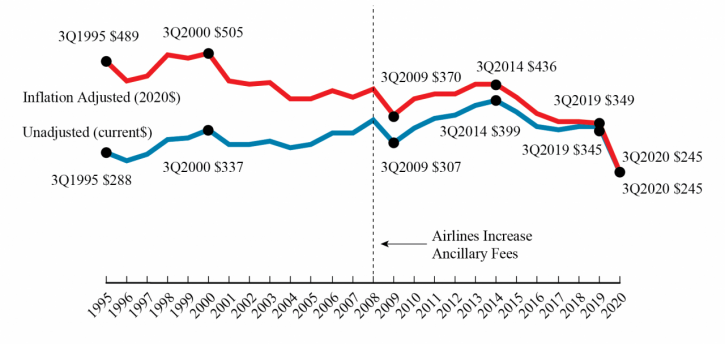
Figure 1. U.S. Average Domestic Fares, 3rd Quarter 1995-2020
| Unadjusted Fares (current dollars) | Inflation-Adjusted (2020$) | |
|---|---|---|
| 1995 | 288 | 489 |
| 1996 | 269 | 445 |
| 1997 | 282 | 456 |
| 1998 | 315 | 501 |
| 1999 | 317 | 493 |
| 2000 | 337 | 505 |
| 2001 | 303 | 443 |
| 2002 | 303 | 436 |
| 2003 | 312 | 440 |
| 2004 | 297 | 406 |
| 2005 | 306 | 404 |
| 2006 | 330 | 422 |
| 2007 | 328 | 409 |
| 2008 | 359 | 425 |
| 2009 | 307 | 370 |
| 2010 | 340 | 404 |
| 2011 | 361 | 414 |
| 2012 | 367 | 414 |
| 2013 | 392 | 435 |
| 2014 | 399 | 436 |
| 2015 | 374 | 408 |
| 2016 | 345 | 372 |
| 2017 | 336 | 355 |
| 2018 | 343 | 354 |
| 2019 | 345 | 349 |
| 2020 | 245 | 245 |
Other Revenue: In recent years, airlines have increasingly obtained additional revenue from passenger fees, as well as from other sources. U.S. passenger airlines collected 65.1% of total operating revenue of $38.6 billion from passenger fares during the first nine months of 2020, down from 88.5% in 1990.
Fares by Airport
Figure 2. Fares by Airport Group based on Number of Originating Domestic Passengers 3Q 2020
| Originating Domestic Passengers | 3Q Fares (current dollars) |
|---|---|
| 1M-1.5M | $250 |
| 500K-1M | $228 |
| 100K-500K | $243 |
| 50K-99K | $244 |
| 38K-50K | $259 |
| Top 100 Airports | $240 |
| All Airports | $245 |
Highest: 18 airports with 38,000-49,999 originating passengers ($259)
Lowest: Nine airports with 500,000-999,999 originating passengers ($228)
Additional data: see Top 100 Airports or All Airports. Fourth Quarter 2020 average fare data will be released April 20.
Standard error: Results for average fares are based on the BTS Origin & Destination Survey, a 10% sample of airline tickets used during the quarter. Averages for airports with smaller samples may be less reliable.
Note: Results for average fares are based on the BTS Origin & Destination Survey, a 10% sample of airline tickets used during the quarter. For Q3 2020 results based on all itinerary fares, the standard error is 0.30 and the median fare is $197.44.
The 90% confidence interval ranges from $244.29 to $245.28. For results based on round-trip fares, the standard error is 0.52 and the median fare is $236.70. The 90% confidence interval ranges from $283.03 to $284.73. For results based on one-way fares, the standard error is 0.34 and the median fare is $157.06. The 90% confidence interval ranges from $200.85 to $201.96.