
Total Passengers on U.S Airlines and Foreign Airlines U.S. Flights Increased 1.3% in 2012 from 2011
The U.S. Department of Transportation’s Bureau of Transportation Statistics (BTS) today reported that 815.3 million scheduled passengers traveled on U.S. airlines and on foreign airlines serving the United States in 2012. This is a 1.3 percent increase from 2011 (Table 1).
Annual Passengers on All U.S. Scheduled Airlines (Domestic & International) and Foreign Airlines to and from the United States, 2006-2012
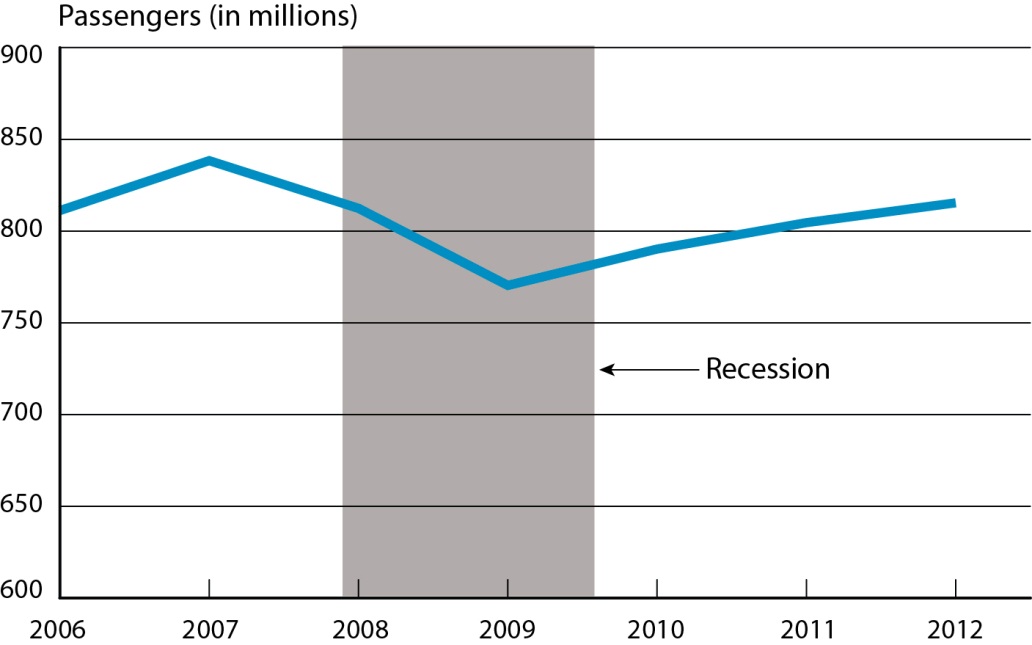
SOURCE for Recession Dates: National Bureau of Economic Research, US Business Cycle Expansions and Contractions
BTS, a part of the Department’s Research and Innovative Technology Administration, in a release of preliminary data, reported that U.S. airlines carried 0.6 percent more domestic passengers in 2012 and 2.0 percent more international passengers than in 2011 for a systemwide increase of 0.8 percent. The number of passengers traveling to and from the United States on foreign carriers increased 6.8 percent from 2011 (Table 1A).
This annual release includes data on U.S. carrier scheduled domestic and international service and foreign carrier scheduled international service to and from the United States. BTS regular monthly air traffic releases include data on U.S. carrier scheduled service only. For U.S. domestic service data for 2012, see the BTS December Air Traffic press release.
The upward trend of international passenger numbers continued with increases from each month of 2011 to the same month in 2012 but domestic numbers decreased from the corresponding month of 2011 during the fall (Tables 2, 6).
Top Airlines in 2012
Delta Air Lines carried more total system passengers in 2012 than any other U.S. airline for the third consecutive year. United Airlines, following its merger with Continental Airlines, carried more international passengers to and from the United States in 2012 than any other U.S. or foreign carrier (Tables 3 and 7).
Top Airports in 2012
More total system passengers boarded planes in 2012 at Atlanta Hartsfield-Jackson International than at any other U.S. airport (Table 4); and more international passengers boarded planes at New York John F. Kennedy than at any other U.S. airport (Table 8).
For more information on U.S. carrier domestic operations, see the BTS December Air Traffic press release.
Load Factor and Capacity
Despite a 2.4 percent rise in revenue passenger-miles, a 1.2 percent increase in capacity, measured in available seat-mikes, resulted in a 0.9 point rise in load factor to 82.5, the highest annual load factor on record for U.S. carriers and foreign carriers serving the United States. U.S. carriers and foreign carriers serving the United States operated 9.8 million domestic and international flights in 2012, 1.7 percent fewer than in 2011 (Table 1).
For annual airline and airport statistics, Tables 1 through 4 provide combined domestic and international travel statistics, and Tables 5 through 8 provide international travel statistics.
Reporting Notes
Data are compiled from monthly reports filed with BTS by commercial U.S. and foreign air carriers detailing operations, passenger traffic and freight traffic. This release includes data received by BTS from 194 carriers as of March 25 for U.S. and foreign carrier scheduled civilian operations. Go to http://www.transtats.bts.gov/releaseinfo.asp for the complete list of reporting and non-reporting carriers. TranStats results for foreign carriers may differ from the press release until the next database update scheduled for April 23.
For additional passenger, flight, Revenue Passenger-Miles, Available Seat-Miles, load factor and freight numbers, go to the Airlines and Airports page and use the Quick Links. International totals and results for foreign carriers may differ from the press release until the next database update scheduled for April 23. These tables do not include U.S. carrier foreign point-to-point operations. For 2012, U.S. carriers reported 2,376,467 foreign point-to-point passengers.
To create a customized table for U.S. carrier passengers, flights, RPMs, ASMs and other data, including non-scheduled service, go to BTS Air Carrier Traffic Statistics.
Additional traffic numbers are available on the BTS website at TranStats, at http://transtats.bts.gov. Click on “Aviation.” For U.S. carrier system passengers, RPMs and ASMs by carrier through December, click on “Air Carrier Summary Data (Form 41 and 298C Summary Data),” and then click on “Schedule T-1.” Use crosstabs to find scheduled service.
For domestic numbers through December and international numbers through September by origin as well as by carrier, after clicking on “Aviation,” click on “Air Carrier Statistics (Form 41 Traffic).” Click on “T-100 Market” for system passenger numbers, “T-100 Domestic Market” for domestic or “T-100 International Market” for international. For flights, stage length and trip length, use the appropriate T-100 Segment database. Use crosstabs to find scheduled service. Complete international data will be released on June 20.
TranStats system and international totals do not include U.S. carriers’ foreign point-to-point flights.
Table 1. Scheduled Domestic and International Airline Travel on
| Annual | |||
|---|---|---|---|
| 2011 | 2012 | Change % | |
| Passengers (in millions) | 804.5 | 815.3 | 1.3 |
| Flights (in thousands) | 9,989.9 | 9,821.0 | -1.7 |
| Revenue Passenger Miles (in billions) | 1,105.9 | 1,132.5 | 2.4 |
| Available Seat-Miles (in billions) | 1,356.0 | 1,372.7 | 1.2 |
| Load Factor** | 81.6 | 82.5 | 0.9 |
| Flight Stage Length*** | 847.2 | 862.9 | 1.8 |
| Passenger Trip Length**** | 1,374.6 | 1,389.1 | 1.1 |
Source: Bureau of Transportation Statistics, T-100 Market and Segment
* Includes U.S. carrier scheduled domestic and international service and foreign carrier scheduled international service to and from the United States. For U.S. domestic service data for 2012, see the BTS December air traffic press release https://www.bts.gov/statistical-releases
** Change in load factor points
*** The average non-stop distance flown per departure in miles
**** The average distance flown per passenger in miles
Note: Percentage changes based on numbers prior to rounding.
Table 1A. Passengers on U.S. Carriers and on Foreign Carriers' U.S. Flights 2011-2012
| 2011 | 2012 | Change % | ||
|---|---|---|---|---|
| U.S. Carrier | Domestic | 638.2 | 642.2 | 0.6 |
| International | 92.5 | 94.4 | 2.0 | |
| System | 730.8 | 736.6 | 0.8 | |
| Foreign Carrier | To and From U.S. | 73.7 | 78.7 | 6.8 |
| Total | 804.5 | 815.3 | 1.3 | |
Source: Bureau of Transportation Statistics, T-100 Market
Table 2. Scheduled Domestic and International Enplanements by Month on U.S. and Foreign Airlines*
Passenger numbers in millions (000,000)
| 2010 | 2011 | 2010-2011 Pct. Change | 2012 | 2011-2012 Pct. Change | |
|---|---|---|---|---|---|
| January | 58.1 | 59.2 | 1.8 | 60.5 | 2.2 |
| February | 53.4 | 54.8 | 2.7 | 58.3 | 6.4 |
| March | 68.0 | 69.3 | 2.0 | 70.8 | 2.1 |
| April | 65.1 | 66.6 | 2.2 | 67.9 | 2.0 |
| May | 67.4 | 70.1 | 4.0 | 70.3 | 0.2 |
| June | 71.3 | 72.8 | 2.1 | 73.7 | 1.2 |
| July | 75.4 | 77.1 | 2.3 | 76.9 | -0.3 |
| August | 72.9 | 73.4 | 0.6 | 75.5 | 2.9 |
| September | 63.1 | 64.4 | 2.0 | 64.1 | -0.4 |
| October | 67.9 | 67.5 | -0.6 | 67.2 | -0.4 |
| November | 63.3 | 64.0 | 1.1 | 64.8 | 1.2 |
| December | 64.2 | 65.3 | 1.6 | 65.3 | 0.0 |
| Yr. Total | 790.2 | 804.5 | 1.8 | 815.3 | 1.3 |
Source: Bureau of Transportation Statistics, T-100 Market
* Includes U.S. carrier scheduled domestic and international service and foreign carrier scheduled international service to and from the United States. For U.S. domestic service data for 2012, see the BTS December air traffic press release https://www.bts.gov/statistical-releases
Note: Percent changes based on numbers prior to rounding.
Table 3. Top 10 Airlines, ranked by January-December 2012 Scheduled Domestic and International Enplanements*
Passenger numbers in millions (000,000)
| 2012 Rank | Airline | 2012 Enplaned Passengers | 2011 Rank | 2011 Enplaned Passengers | Pct. Change 2011-2012 |
|---|---|---|---|---|---|
| 1 | Delta | 116.445 | 1 | 113.485 | 2.6 |
| 2 | Southwest** | 112.234 | 2 | 110.587 | 1.5 |
| 3 | UA/CO Combined*** | 92.367 | - | 95.611 | -3.4 |
| United | 92.367 | 5 | 50.474 | NA | |
| Continental | - | 6 | 45.138 | NA | |
| 4 | American | 86.335 | 3 | 86.042 | 0.3 |
| 5 | US Airways | 54.238 | 4 | 52.921 | 2.5 |
| 6 | EV/XE Combined**** | 32.376 | - | 30.412 | 6.5 |
| ExpressJet | 32.376 | 12 | 16.194 | NA | |
| Atlantic Southeast | - | 13 | 14.218 | NA | |
| 7 | JetBlue | 28.934 | 7 | 26.353 | 9.8 |
| 8 | SkyWest | 26.163 | 9 | 24.408 | 7.2 |
| 9 | AirTran | 21.745 | 8 | 24.596 | -11.6 |
| 10 | American Eagle | 18.731 | 11 | 17.348 | 8.0 |
Source: Bureau of Transportation Statistics, T-100 Market
* Includes U.S. carrier scheduled domestic and international service and foreign carrier scheduled international service to and from the United States. For U.S. domestic service data for 2012, see the BTS December air traffic press release https://www.bts.gov/statistical-releases
** Southwest and AirTran are reporting as separate carriers with the exception of the financials. They have one FAA SOC (single operating certificate), requiring that they utilize the same safety/operating procedures, but they have separate DOT 401 economic certificates, meaning they are operating as separate economic entities.
*** United's 2012 number is the report of the merged United and Continental. The 2011 numbers were reported separately by United and Continental
**** ExpressJet's 2012 number the report of the merged ExpressJet and Atlantic Southeast. The 2011 numbers were reported separately by ExpressJet and Atlantic Southeast
Note: Percentage changes based on numbers prior to rounding.
Table 4. Top 10 Airports ranked by January-December 2012 Scheduled Domestic and International Enplanements on U.S. and Foreign Airlines*
Passenger numbers in millions (000,000)
| 2012 Rank | Airport | 2012 Enplaned Passengers | 2011 Rank | 2011 Enplaned Passengers | Pct. Change 2011-2012 |
|---|---|---|---|---|---|
| 1 | Atlanta | 45.713 | 1 | 44.249 | 3.3 |
| 2 | Chicago O'Hare | 32.063 | 2 | 31.841 | 0.7 |
| 3 | Los Angeles | 31.293 | 3 | 30.505 | 2.6 |
| 4 | Dallas/Ft. Worth | 27.988 | 4 | 27.430 | 2.0 |
| 5 | Denver | 25.776 | 5 | 25.635 | 0.6 |
| 6 | New York JFK | 24.423 | 6 | 23.586 | 3.5 |
| 7 | San Francisco | 21.272 | 7 | 20.049 | 6.1 |
| 8 | Charlotte | 20.017 | 11 | 19.007 | 5.3 |
| 9 | Las Vegas | 19.774 | 9 | 19.668 | 0.5 |
| 10 | Phoenix | 19.537 | 8 | 19.727 | -1.0 |
Source: Bureau of Transportation Statistics, T-100 Market
* Includes U.S. carrier scheduled domestic and international service and foreign carrier scheduled international service to and from the United States. For U.S. domestic service data for 2012, see the BTS December air traffic press release https://www.bts.gov/statistical-releases
Note: Percentage changes based on numbers prior to rounding.
Table 5. International Scheduled Airline Travel on U.S. and Foreign Airlines*
| Annual | |||||
|---|---|---|---|---|---|
| 2011 | 2011 % of Total | 2012 | 2012 % of Total | 2011-2012 Change % | |
| Passengers (in millions) | 166.2 | 173.1 | 4.1 | ||
| U.S. Carriers | 92.5 | 55.7 | 94.4 | 54.5 | 2.0 |
| Foreign Carriers | 73.7 | 44.3 | 78.7 | 45.5 | 6.8 |
| Flights (in thousands) | 1,340.8 | 1,378.3 | 2.8 | ||
| U.S. Carriers | 830.9 | 62.0 | 842.6 | 61.1 | 1.4 |
| Foreign Carriers | 509.9 | 38.0 | 535.7 | 38.9 | 5.1 |
| Revenue Passenger Miles (in billions) | 541.2 | 562.6 | 3.9 | ||
| U.S. Carriers | 250.7 | 46.3 | 254.5 | 45.2 | 1.5 |
| Foreign Carriers | 290.5 | 53.7 | 308.1 | 54.8 | 6.1 |
| Available Seat-Miles (in billions) | 674.6 | 689.0 | 2.1 | ||
| U.S. Carriers | 312.6 | 46.3 | 312.5 | 45.4 | 0.0 |
| Foreign Carriers | 362.0 | 53.7 | 376.5 | 54.6 | 4.0 |
| Load Factor** | 80.2 | 81.6 | 1.4 | ||
| U.S. Carriers | 80.2 | 81.4 | 1.2 | ||
| Foreign Carriers | 80.2 | 81.8 | 1.6 | ||
| Flight Stage Length*** | 2,208.7 | 2,183.8 | -1.1 | ||
| Passenger Trip Length**** | 3,255.3 | 3,250.2 | -0.2 | ||
Source: Bureau of Transportation Statistics, T-100 International Market and International Segment
* Includes U.S. carrier scheduled domestic and international service and foreign carrier scheduled international service to and from the United States. For U.S. domestic service data for 2012, see the BTS December air traffic press release https://www.bts.gov/statistical-releases
** Change in load factor points
*** The average non-stop distance flown per departure in miles
**** The average distance flown per passenger in miles
Note: Percentage changes based on numbers prior to rounding.
Table 6. International Scheduled Enplanements by Month on U.S. and Foreign Airlines*
Passenger numbers in millions (000,000)
| 2010 | 2011 | 2010-2011 Pct. Change | 2012 | 2011-2012 Pct. Change | |
|---|---|---|---|---|---|
| January | 12.6 | 12.9 | 2.2 | 13.4 | 3.9 |
| February | 10.9 | 11.2 | 2.2 | 11.9 | 6.8 |
| March | 13.5 | 13.7 | 0.9 | 14.6 | 6.8 |
| April | 12.6 | 13.7 | 8.7 | 14.2 | 3.6 |
| May | 13.6 | 14.1 | 3.9 | 14.5 | 2.7 |
| June | 14.6 | 15.0 | 2.7 | 15.8 | 5.2 |
| July | 16.3 | 16.8 | 3.5 | 17.2 | 2.1 |
| August | 15.6 | 16.0 | 2.7 | 16.9 | 5.6 |
| September | 12.8 | 13.4 | 4.8 | 14.0 | 4.4 |
| October | 13.1 | 13.4 | 2.1 | 13.5 | 1.2 |
| November | 11.9 | 12.3 | 3.7 | 12.9 | 4.9 |
| December | 13.2 | 13.7 | 4.5 | 14.1 | 2.7 |
| Yr. Total | 160.7 | 166.2 | 3.5 | 173.1 | 4.1 |
Source: Bureau of Transportation Statistics, T-100 International Market
* Includes U.S. carrier scheduled domestic and international service and foreign carrier scheduled international service to and from the United States. For U.S. domestic service data for 2012, see the BTS December air traffic press release https://www.bts.gov/statistical-releases
Note: Percentage changes based on numbers prior to rounding.
Table 7. Top 10 Airlines, ranked by January-December 2012 International Scheduled Enplanements*
Passenger numbers in thousands (000)
| 2012 Rank | Airline | 2012 Enplaned Passengers | 2011 Rank | 2011 Enplaned Passengers | Pct. Change 2011-2012 |
|---|---|---|---|---|---|
| 1 | UA/CO Combined** | 24,833.7 | - | 24,903.4 | -0.3 |
| United | 24,833.7 | 4 | 10,945.0 | NA | |
| Continental | - | 3 | 13,958.4 | NA | |
| 2 | American | 21,325.5 | 1 | 20,808.7 | 2.5 |
| 3 | Delta | 21,006.4 | 2 | 20,774.2 | 1.1 |
| 4 | US Airways | 6,795.5 | 5 | 6,749.9 | 0.7 |
| 5 | British Airways | 6,716.1 | 6 | 6,122.3 | 9.7 |
| 6 | Air Canada | 5,916.1 | 7 | 5,678.9 | 4.2 |
| 7 | Lufthansa | 5,069.2 | 8 | 5,172.9 | -2.0 |
| 8 | JetBlue | 4,063.7 | 10 | 3,428.9 | 18.5 |
| 9 | WestJet | 3,569.1 | 12 | 3,100.9 | 15.1 |
| 10 | Air France | 3,446.8 | 9 | 3,640.7 | -5.3 |
Source: Bureau of Transportation Statistics, T-100 International Market
* Includes U.S. carrier scheduled domestic and international service and foreign carrier scheduled international service to and from the United States. For U.S. domestic service data for 2012, see the BTS December air traffic press release https://www.bts.gov/statistical-releases
** United's 2012 number is the report of the merged United and Continental. The 2011 numbers were reported separately by United and Continental
Note: Percentage changes based on numbers prior to rounding.
Table 8. Top 10 Airports ranked by January-December 2012 International Scheduled Enplanements on U.S. and Foreign Airlines*
Passenger numbers in thousands (000)
| 2012 Rank | Airport | 2012 Enplaned Passengers | 2011 Rank | 2011 Enplaned Passengers | Pct. Change 2011-2012 |
|---|---|---|---|---|---|
| 1 | New York JFK | 12,334.2 | 1 | 11,706.1 | 5.4 |
| 2 | Miami | 9,314.5 | 2 | 8,828.3 | 5.5 |
| 3 | Los Angeles | 8,273.4 | 3 | 8,065.3 | 2.6 |
| 4 | Newark | 5,577.1 | 4 | 5,710.0 | -2.3 |
| 5 | Chicago O'Hare | 5,055.2 | 5 | 5,150.7 | -1.9 |
| 6 | Atlanta | 4,775.5 | 6 | 4,675.6 | 2.1 |
| 7 | San Francisco | 4,534.8 | 7 | 4,334.5 | 4.6 |
| 8 | Houston Bush | 4,220.5 | 8 | 4,198.4 | 0.5 |
| 9 | Washington Dulles | 3,205.1 | 9 | 3,118.0 | 2.8 |
| 10 | Dallas/Ft. Worth | 2,885.1 | 10 | 2,603.0 | 10.8 |
Source: Bureau of Transportation Statistics, T-100 International Market
* Includes U.S. carrier scheduled domestic and international service and foreign carrier scheduled international service to and from the United States. For U.S. domestic service data for 2012, see the BTS December air traffic press release https://www.bts.gov/statistical-releases
Note: Percentage changes based on numbers prior to rounding.