
Transportation Services Contributed 6.5% to U.S. GDP in 2023; a Decrease from 6.6% in 2022 but Still Above the Pre-Pandemic 2019 6.3%
Transportation contributed $1.8 trillion (6.5%) to the economy in 2023
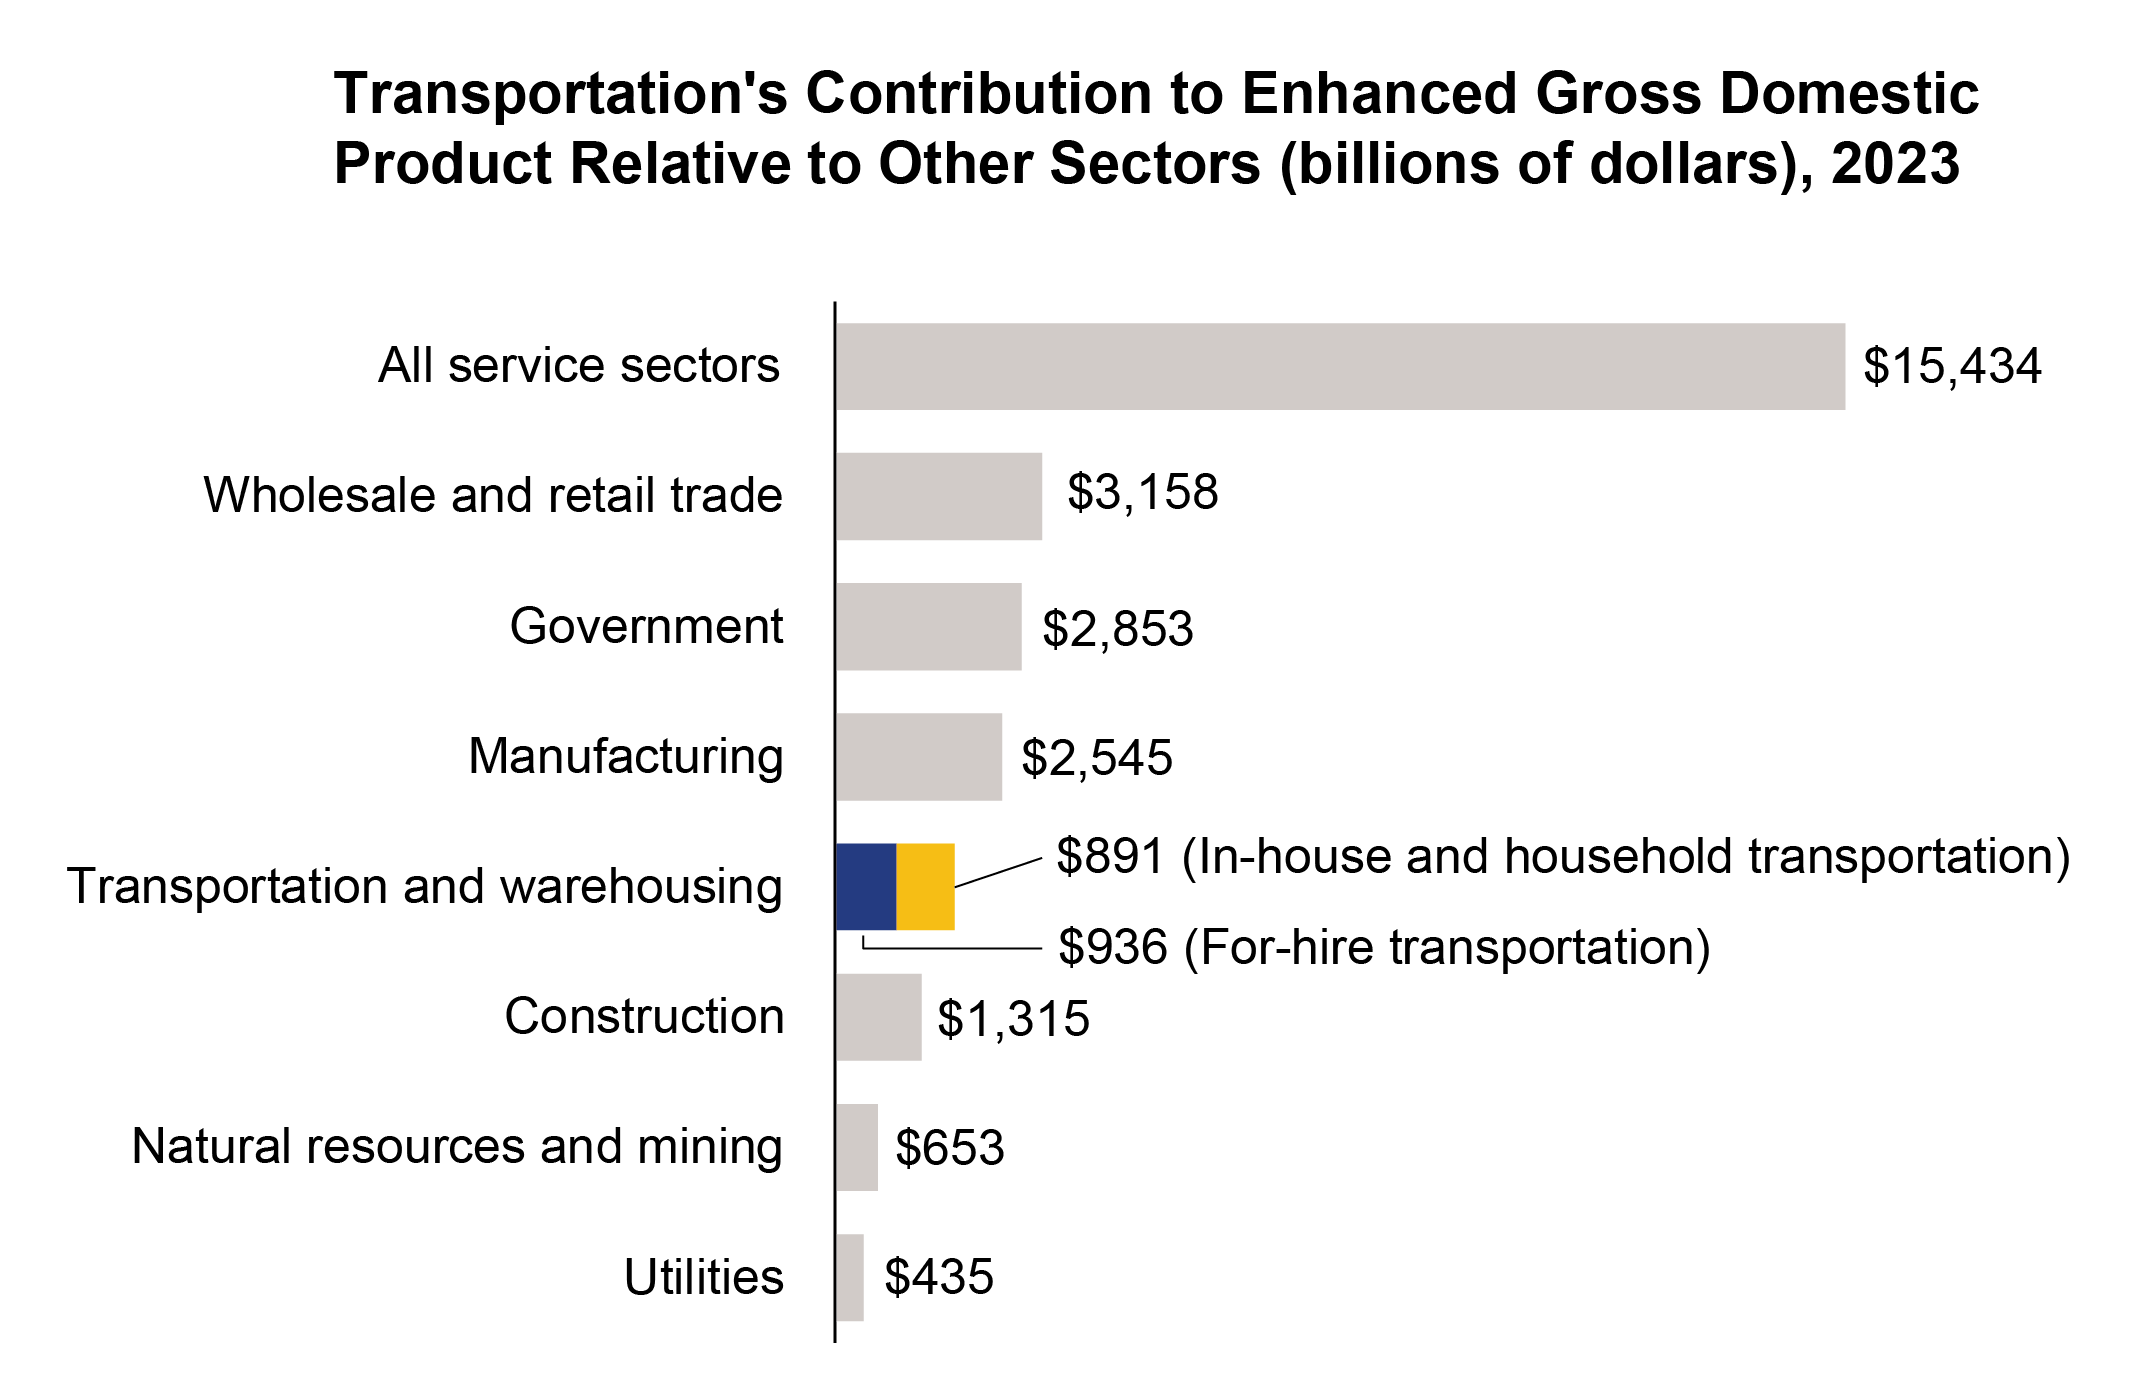
Transportation services (for-hire, in-house, and household) contributed $1.8 trillion (6.5%) to an enhanced U.S. gross domestic product (GDP)1 of $28.2 trillion in 2023—as measured by the Bureau of Transportation Statistics' (BTS) Transportation Satellite Accounts (TSAs). The TSAs measure the full contribution of transportation to the economy from three types of transportation activities:
- $935.5 billion or 3.3% of 2023 enhanced GDP from for-hire transportation,
- $392.6 billion or 1.4% of 2023 enhanced GDP from transportation activities carried out by non-transportation industries for their own purposes (known as in-house transportation),
- $498.3 billion or 1.8% of 2023 enhanced GDP from transportation activities carried out by households using personal motor vehicles.
Accounting for the contribution of in-house and household transportation nearly doubles the overall contribution of transportation to the economy as measured by enhanced GDP (figure 1). Including in-house and household transportation brought transportation up from the sixth largest contributor (out of eight sectors) to the fifth largest contributor to the economy in 2023.
Source: U.S. Department of Transportation, Bureau of Transportation Statistics, Transportation Satellite Accounts, available at www.bts.gov/satellite-accounts
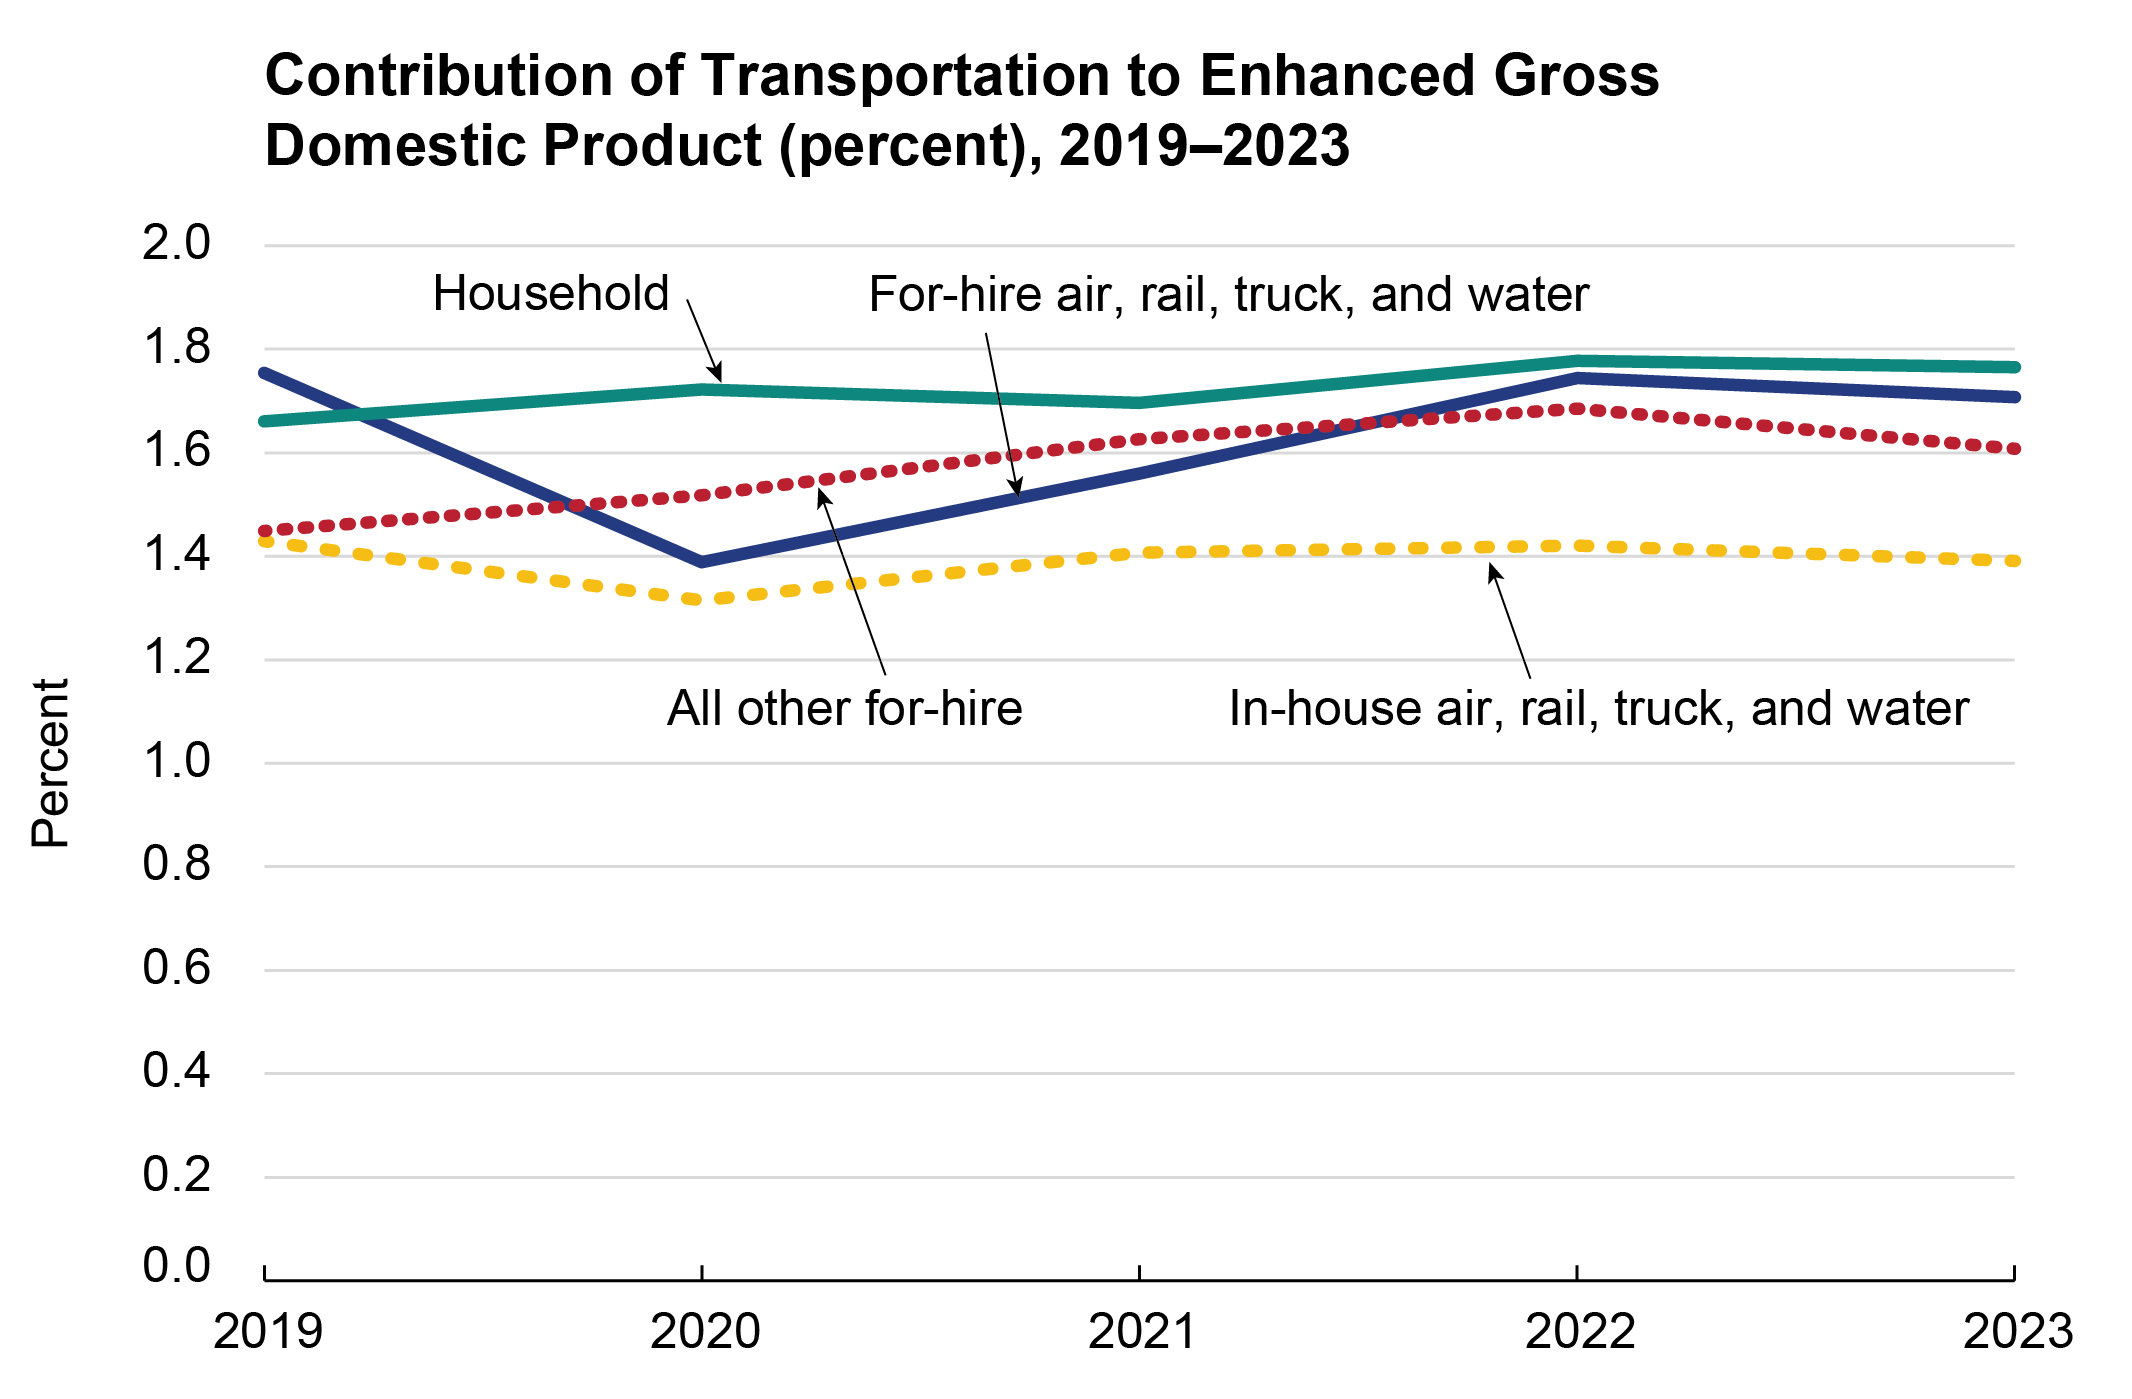
Transportation’s Contribution to the Economy Fell in 2023 from 2022 But Remains Above 2020 and 2019
The contribution of transportation (not adjusted for inflation) increased from $1,755.4 billion in 2022 to $1,826.5 billion in 2023, but due to GDP increasing more, transportation, as a share of GDP, fell from 6.6% in 2022 to 6.5% in 2023. The share fell due to all other for-hire2 transportation contributing less in 2023 than in 2022.
Despite falling from the 2022 level, transportation’s contribution to the economy in 2023 remains above the pre-pandemic 2019 level of 6.3%. The contribution of in-house air, rail, water, and truck transportation returned to the pre-pandemic 2019 level of 1.4% in 2021, after falling 0.1 percentage point in 2020, and remained unchanged, at 1.4%, from 2021 to 2023. Household transportation contributed the same share to enhanced GDP in 2023 and 2022 at 1.8% — up 0.1 percentage point from its contribution of 1.7% in 2019 through 2021.
For-hire air, rail, truck, and water transportation’s contribution to enhanced GDP remained unchanged in 2023 from 2022 (1.7%) and remained 0.1 percentage point below its 2019 contribution. All other transportation’s contribution of 1.6% fell 0.1 percentage point from 2022 to 2023 but remained 0.2 percentage points above the 2019 contribution.
Source: U.S. Department of Transportation, Bureau of Transportation Statistics, Transportation Satellite Accounts, available at www.bts.gov/satellite-accounts
BTS released the TSAs with data for 2023 and revised years 2018 to 2022. The release includes a new tool to access the data and a user guide on how to use the tool. BTS publishes several interactive visualizations highlighting the TSAs, including the Contribution of Transportation Services to the Economy and the Transportation Satellite Accounts, The Use of Transportation by Industry or Sector, and the Industry Snapshots.
1 Enhanced GDP is the sum of GDP published in the U.S. National Accounts by the Bureau of Economic Analysis and the contribution of household transportation.
2 All other for-hire transportation includes transit and passenger ground transportation (excluding state and local government passenger transit); sightseeing transportation and transportation support; parcel delivery, courier, and messenger services (excluding U.S. Postal Service); warehousing and storage; and other transportation and support activities.