
U.S. Airlines’ 2021 Total Fuel Use Decreases 25% from Pre-Pandemic 2019; December 2021 Fuel Use Down 13% from December 2019
December 2021 fuel cost per gallon decreases 7.4% from November to $1.98
The Department of Transportation’s Bureau of Transportation Statistics (BTS) today released U.S. airlines’ December Fuel Cost and Consumption numbers indicating U.S. airlines used 1.35 billion gallons of fuel, 7.5% more fuel than in November 2021 and 13.2% less than in pre-pandemic December 2019. At $2.14, the cost per gallon of fuel in November 2021 was down 17 cents (7.4%) from November’s $2.31 and up 14 cents (7.0%) from December 2019’s $2.00 per gallon. To date, the pandemic-low fuel cost per gallon was May 2020’s $1.03. Total December 2021 fuel cost ($2.88B) was up 0.68% from November 2021 ($2.90B) and down 7.54% from pre-pandemic December 2019 ($3.11B).
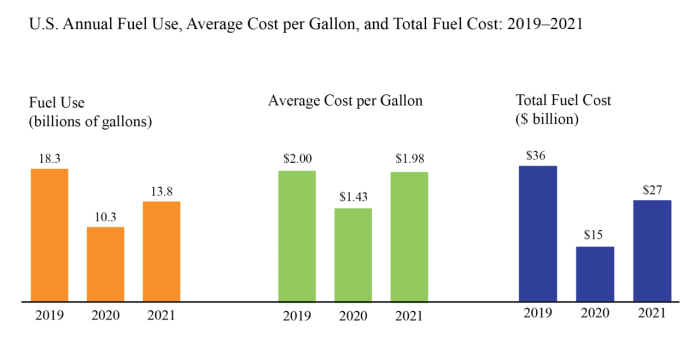
For the year, U.S. airlines used 13.78 billion gallons of fuel, a 24.6% decrease from pre-pandemic 2019’s 18.27 billion gallons. Average fuel cost per gallon in 2021 was $1.98, a 2.0% decrease from 2019’s $2.00. In 2021, the airlines spent $27.2 billion on fuel, a decrease of 25.3% from 2019’s $36.5 billion.
Fuel consumed by U.S. airlines scheduled service:
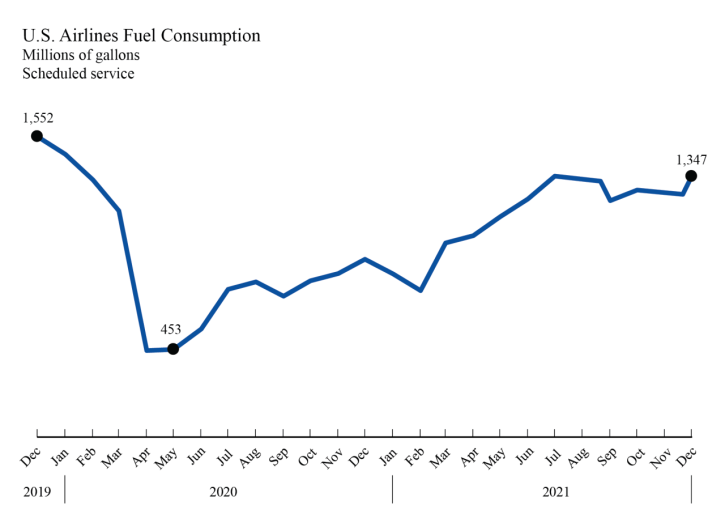
December 2019: 1.55 billion gallons
December 2020: 918 million gallons
November 2021: 1.25 billion gallons
December 2021: 1.35 billion gallons
2019 total: 18.27 billion gallons
2020 total: 10.28 billion gallons
2021 total: 13.78 billion gallons
Fuel cost per gallon for U.S. airlines scheduled service:
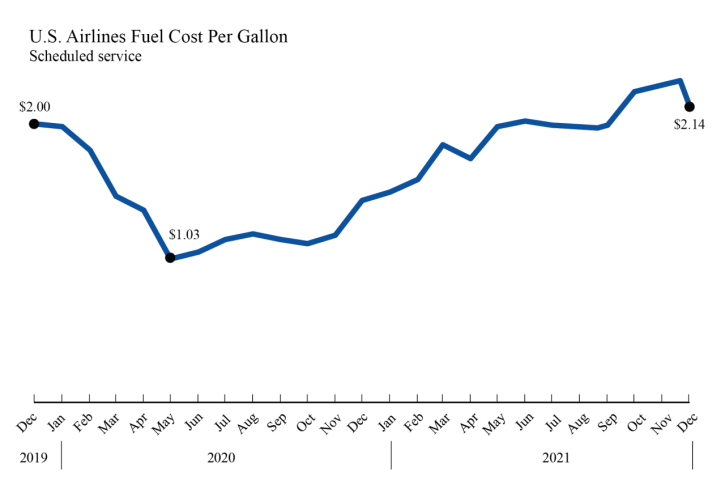
December 2019: $2.00
December 2020: $1.45
November 2021: $2.31
December 2021: $2.14
2019 average: $2.00
2020 average: $1.43
2021 average: $1.98
Total fuel cost for U.S. airlines scheduled service:
December 2019: $3.11 billion
December 2020: $1.33 billion
November 2021: $2.90 billion
December 2021: $2.88 billion
2019 total: $36.5 billion
2020 total: $14.7 billion
2021 total: $27.2 billion
Fuel Cost and Consumption data from January 2000 to the present can be found at https://www.transtats.bts.gov/fuel.asp. Summaries by month are also available.
Preliminary fuel cost and consumption numbers are industry summaries only. Airline fuel costs may be affected by hedging, contracts that allow airlines to limit exposure to future price changes. The monthly web update with January data is scheduled for March 2, 2022.
Individual airline numbers through September are available on the BTS website. Individual airline numbers for October and November will be available with the BTS fourth-quarter 2021 financial release on March 7.
###