
U.S. Airlines’ August 2022 Fuel Consumption Down 8.5% from Pre-Pandemic August 2019; Aviation Fuel Cost per Gallon Drops 6.5% in August from July 2022
The Department of Transportation’s Bureau of Transportation Statistics (BTS) today released U.S. airlines’ August fuel cost and consumption numbers indicating U.S. scheduled service airlines used 1.51 billion gallons of fuel, 0.7% less fuel than in July 2022 (15 million gallons) and 8.5% less than in pre-pandemic August 2019. The cost per gallon of fuel in August 2022 ($3.47) was down 24 cents (6.5%) from July 2022 ($3.71) and up $1.53 (78.9%) from August 2019. Total August 2022 fuel expenditure ($5.23B) was down 7.3% from July 2022 ($5.64B) and up 62.9% from pre-pandemic August 2019.
Year-over-year increases in fuel consumption and cost for August include 4.5% in domestic fuel consumption, 82.7% in domestic fuel cost, and 74.2% in cost per gallon. Domestic fuel consumption decreased 1.3% from July to August in 2022, but increased 4.5% from August 2019. Increased fuel consumption reflects an increase in airline passenger travel over the same period.
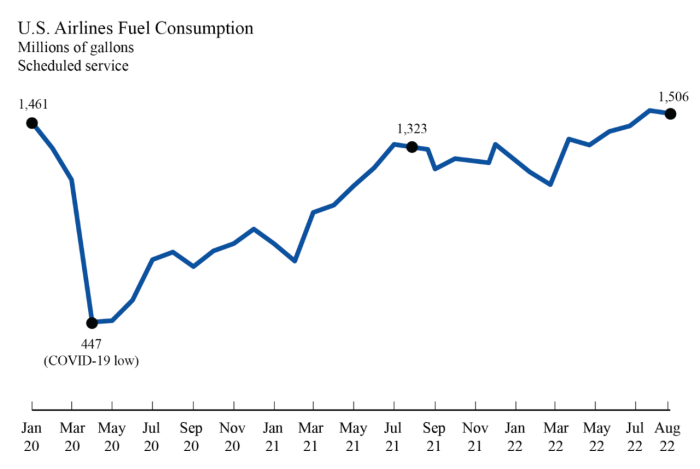
Fuel consumed by U.S. airlines (total) scheduled service:
August 2019: 1.65 billion gallons
August 2021: 1.32 billion gallons
July 2022: 1.52 billion gallons
August 2022: 1.51 billion gallons
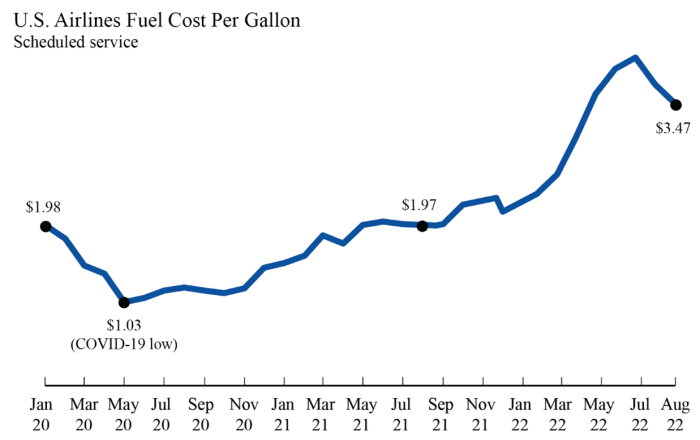
Fuel cost per gallon for U.S. airlines (total) scheduled service:
August 2019: $1.94
August 2021: $1.97
July 2022: $3.71
August 2022: $3.47
Total fuel cost for U.S. airlines (total) scheduled service:
August 2019: $3.21 billion
August 2021: $2.61 billion
July 2022: $5.64 billion
August 2022: $5.23 billion
Fuel Cost and Consumption data from January 2000 to the present can be found at https://www.transtats.bts.gov/fuel.asp. Summaries by month are also available.
Airline fuel costs may be affected by hedging, contracts that allow airlines to limit exposure to future price changes.
Individual airline numbers through June 2022 are available on the BTS website.
###