
U.S. Airlines Carry 58.4 Million Passengers in September 2021 (Preliminary), Still Down 20% from Pre-Pandemic September 2019
BTS 69-21
Contact: Todd Solomon
Tel: 202-366-0573
todd.solomon@dot.gov
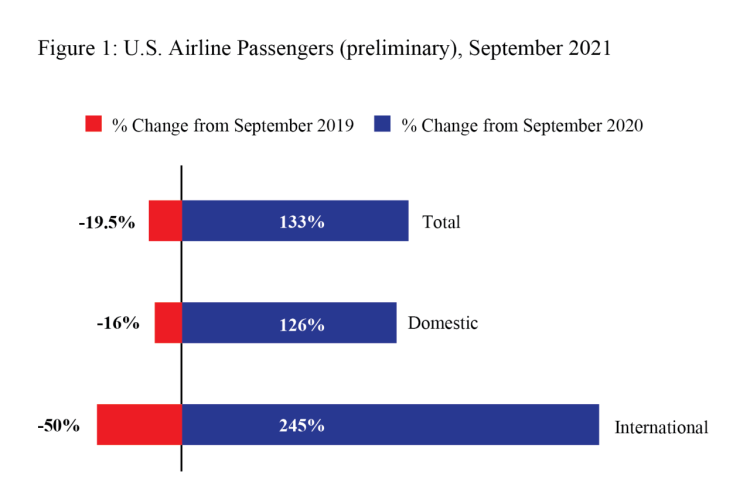
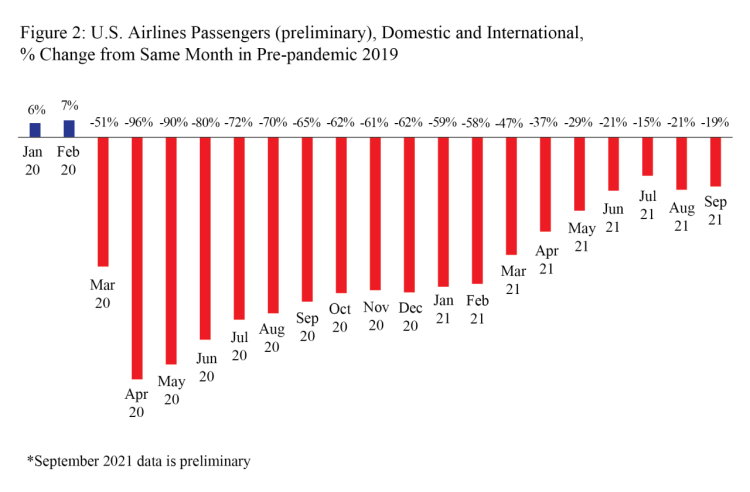
U.S. airlines carried 58.4 million passengers in September 2021 (preliminary), compared to 25.1 million passengers in September 2020 according to data filed with the Bureau of Transportation Statistics (BTS) by 20 airlines that carry more than 90% of passengers. The 133% increase was the smallest year-over-year growth since March (see Figure 2). September 2021’s tally of 58.4 million passengers is down 19.5% from pre-pandemic September 2019’s 72.6 million.
Preliminary September 2021 passenger numbers (20 carriers reporting):
- Total: 58.4 million passengers, up 133% from September 2020 (25.1M)
- Domestic: 53.6 million passengers, up 126% from September 2020 (23.7M)
- International: 4.8 million passengers, up 245% from September 2020 (1.4M)
U.S. airline traffic reports are filed monthly with BTS. Final September data will be released on December 16. Complete international data by origin and destination, which is under a six-month confidentiality restriction, will be released in March 2022.
Systemwide Passengers
- September 2021 passengers: 58.4M
- Change from September 2020: 133%
- Change from September 2019: -19.5%
- Change from April 2020 COVID-19 low: +55.5M passengers
Table 1: Systemwide Percent Change in US Airlines Scheduled Service Passengers from the Same Month of the Previous Year, 2017-2021
|
Year-to-Year Percent Change |
||||
|
|
2017 - 2018 |
2018 - 2019 |
2019 - 2020 |
2020 - 2021 |
|
January |
3.0 |
5.2 |
5.7 |
-61.5 |
|
February |
5.8 |
4.2 |
6.7 |
-60.8 |
|
March |
4.6 |
6.4 |
-51.3 |
9.5 |
|
April |
6.0 |
3.9 |
-96.1 |
1492.3 |
|
May |
6.1 |
5.3 |
-90.1 |
617.3 |
|
June |
6.2 |
3.7 |
-80.3 |
300.3 |
|
July |
6.4 |
3.7 |
-72.4 |
206.7 |
|
August |
6.3 |
3.5 |
-69.8 |
164.6 |
|
September |
7.1 |
5.7 |
-65.2 |
132.5* |
|
October |
5.0 |
4.2 |
-61.8 |
|
|
November |
5.7 |
0.5 |
-60.7 |
|
|
December |
4.8 |
8.9 |
-61.5 |
|
|
Jan - Sep |
5.8 |
4.6 |
-59.8 |
67.1 |
|
Annual |
5.6 |
4.6 |
-60.2 |
|
Source: Bureau of Transportation Statistics, T-100 Market
* September 2021 data is preliminary
Domestic Passengers
- September 2021 passengers: 53.6M
- Change from September 2020: 126%
- Change from September 2019: -16%
- Change from April 2020 COVID-19 low: +50.8M passengers
- Domestic percent of total September 2021 passengers: 92%
- Domestic percent of total September 2020 passengers: 94%
- Domestic percent of total September 2019 passengers: 88%
Table 2: Domestic Percent Change in US Airlines Scheduled Service Passengers from the Same Month of the Previous Year, 2017-2021
|
Year-to-Year Percent Change |
||||
|
|
2017 - 2018 |
2018 - 2019 |
2019 - 2020 |
2020 - 2021 |
|
January |
3.3 |
5.3 |
6.2 |
-60.6 |
|
February |
6.0 |
4.2 |
7.5 |
-59.1 |
|
March |
4.2 |
6.7 |
-51.0 |
14.3 |
|
April |
7.0 |
3.8 |
-95.7 |
1426.5 |
|
May |
6.6 |
5.3 |
-89.0 |
571.6 |
|
June |
6.6 |
3.6 |
-77.9 |
272.8 |
|
July |
7.2 |
3.9 |
-69.6 |
191.1 |
|
August |
6.9 |
3.5 |
-67.1 |
153.3* |
|
September |
7.2 |
5.9 |
-62.7 |
125.8* |
|
October |
5.0 |
4.3 |
-59.9 |
|
|
November |
5.8 |
0.3 |
-59.4 |
|
|
December |
5.0 |
9.6 |
-60.9 |
|
|
Jan - Sep |
6.1 |
4.6 |
-58.2 |
68.0 |
|
Annual |
5.9 |
4.6 |
-58.7 |
|
Source: Bureau of Transportation Statistics, T-100 Domestic Market
*September 2021 data is preliminary
International Passengers
- September 2021 passengers: 4.8M
- Change from September 2020: 245%
- Change from September 2019: -50%
- Change from April 2020 COVID-19 low: +4.7M passengers
- International percent of total September 2021 passengers: 8%
- International percent of total September 2020 passengers: 6%
- International percent of total September 2019 passengers: 12%
Table 3: International Percent Change in US Airlines Scheduled Service Passengers from the Same Month of the Previous Year, 2017-2021
|
Year-to-Year Percent Change |
||||
|
|
2017 - 2018 |
2018 - 2019 |
2019 - 2020 |
2020 - 2021 |
|
January |
1.3 |
4.8 |
2.1 |
-67.5 |
|
February |
4.8 |
3.8 |
1.0 |
-73.4 |
|
March |
7.4 |
3.8 |
-53.3 |
-25.7 |
|
April |
-0.6 |
4.7 |
-98.6 |
2923.3 |
|
May |
2.7 |
5.7 |
-98.1 |
2530 |
|
June |
3.7 |
4.3 |
-96.4 |
1414.6 |
|
July |
1.9 |
2.3 |
-90.4 |
525.8 |
|
August |
2.5 |
3.9 |
-87.5 |
360.0 |
|
September |
6.3 |
4.7 |
-83.7 |
245.1* |
|
October |
4.6 |
3.4 |
-77.3 |
|
|
November |
5.0 |
2.4 |
-70.3 |
|
|
December |
3.6 |
4.0 |
-66.0 |
|
|
Jan - Sep |
3.2 |
4.2 |
-70.2 |
58.3 |
|
Annual |
3.5 |
4.0 |
-70.4 |
|
Source: Bureau of Transportation Statistics, T-100 International Market
*September 2021 data is preliminary
Reporting Notes
Data are compiled from monthly reports filed with BTS by commercial U.S. air carriers detailing operations, passenger traffic and freight traffic. This release includes data received by BTS from U.S. airlines as of November 9, 2021.
See the BTS Airlines and Airport page for additional U.S. airlines numbers through August 2021 for U.S. airlines. International data by origin and destination is available through May 2021.
None of the data are from samples. Measures of statistical significance do not apply to the complete air traffic data.