


U.S. Cargo and Passenger Airlines Gained 1,974 Jobs in May 2026
BTS 26-59
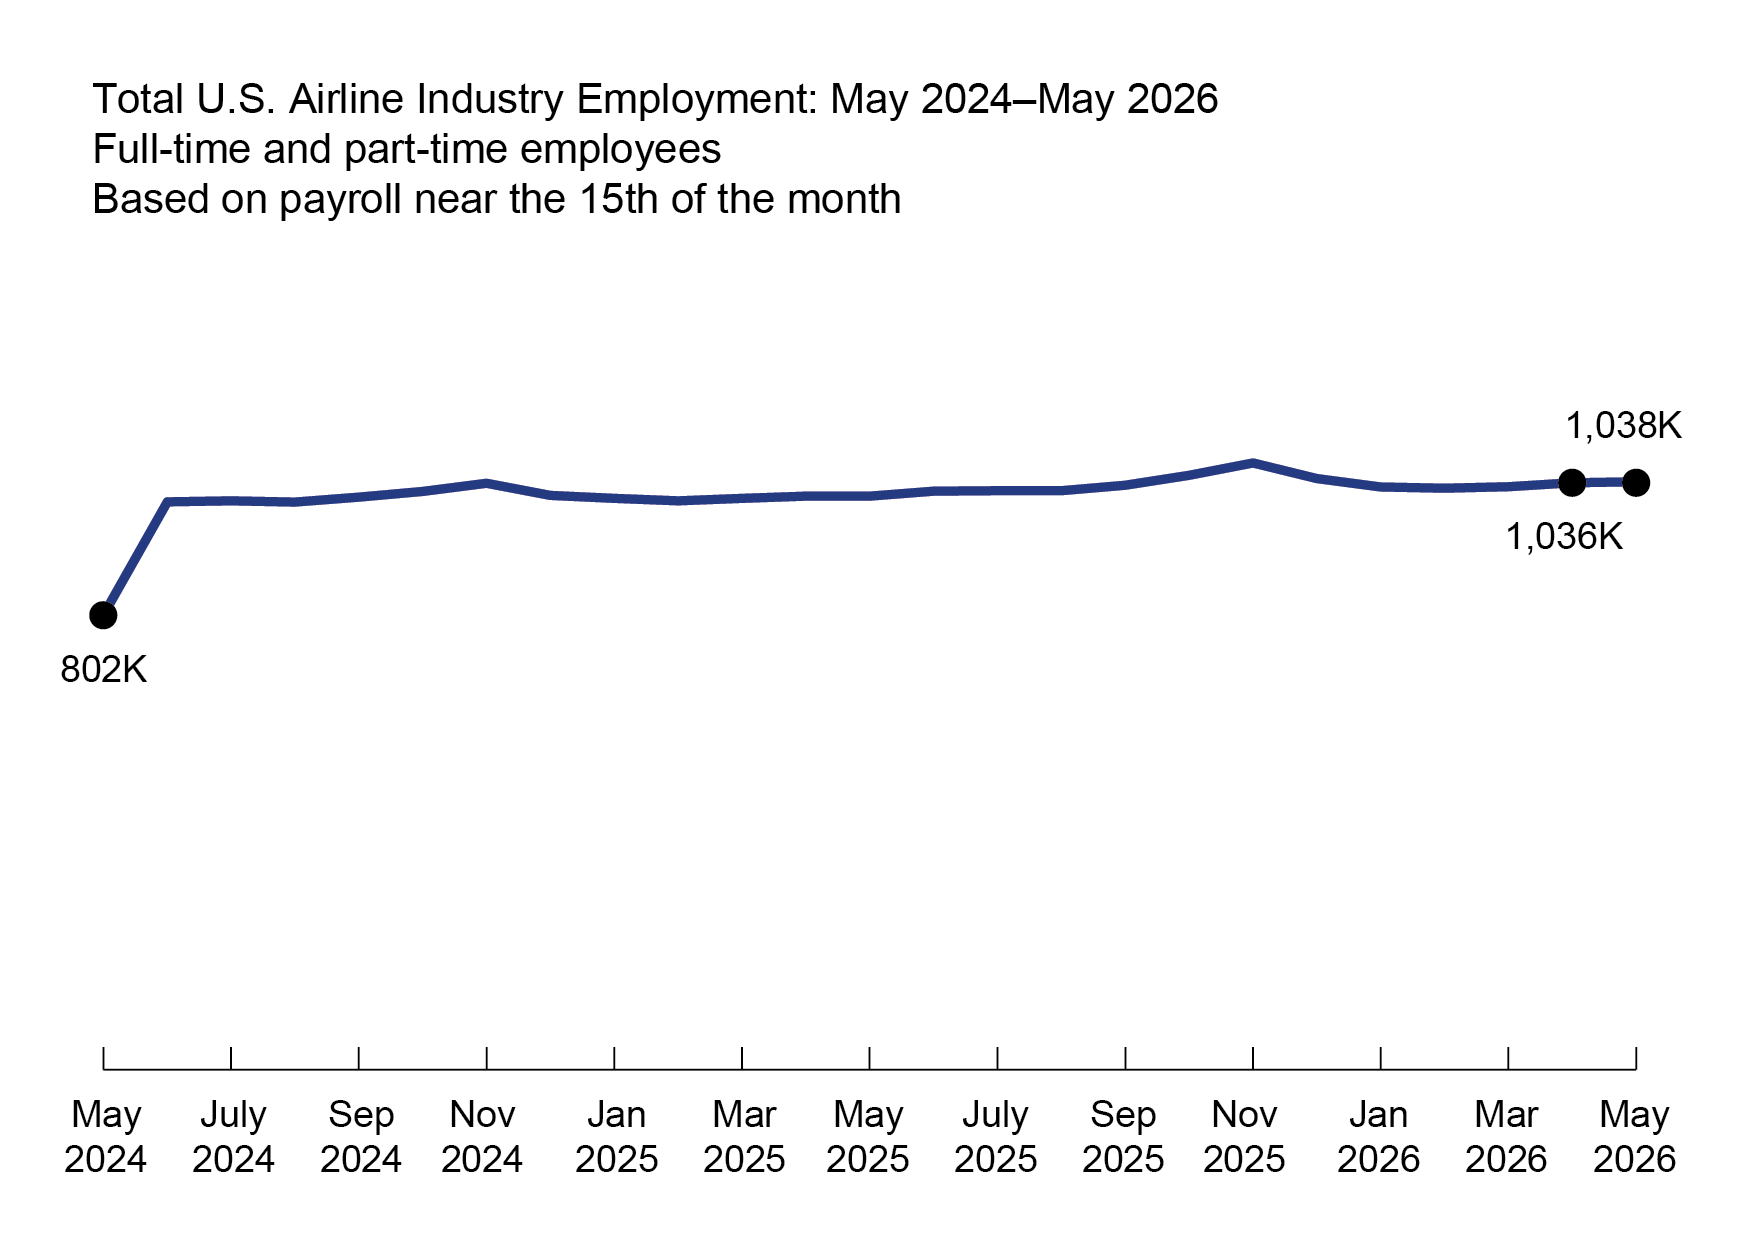
This release is published on a fixed schedule as required by the Office of Management and Budget, and statistics in this release may be revised when inputs to the statistics are corrected or updated. Data on the program page of this website are the most up-to-date and complete.
Note: In June 2024, FedEx Ground and FedEx Services merged with FedEx Express to form Federal Express Corporation. Consequently, carrier FX experienced a significant increase in employee count, thereby increasing the total number of employees within the industry.
May 2024 Federal Express numbers are 233,739, while Federal Express Corporation June 2024 numbers are 432,127.
Alaska Airlines and Hawaiian Airlines have merged and employment from both companies is now reported solely under Alaska Airlines. Hawaiian Airlines no longer reports separate employment numbers.
U.S. Airlines: Total Number of Employees (both Full-Time and Part-Time)
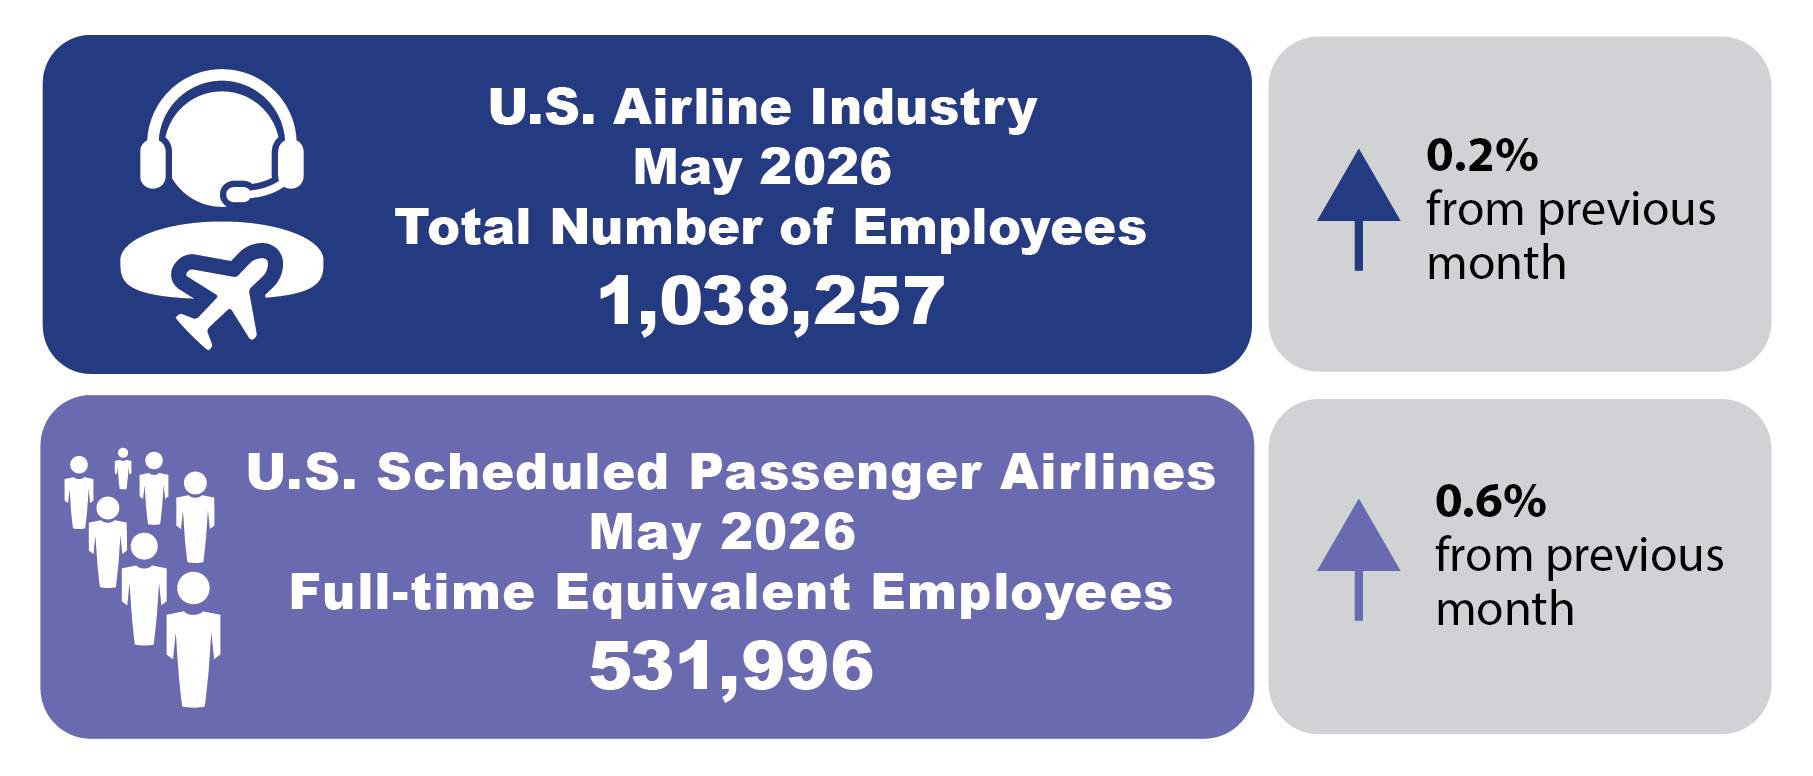
U.S. airline industry (passenger and cargo airlines combined) employment increased to 1,038,257 workers in May 2026, 1,974 (0.19%) more workers than in April 2026 (1,036,283).
U.S. scheduled-service passenger airlines employed 562,966 workers in May 2026, or 54% of the industry-wide total. Passenger airlines gained 3,411 employees in May 2026. American Airlines Inc. led scheduled passenger carriers, adding 1,151 employees; United Air Lines Inc. added 975, and Delta Air Lines Inc. added 963.
U.S. cargo airlines employed 470,865 workers in May 2026, or 46% of the industry-wide total. Cargo carriers lost 1,457 employees in May. FedEx, the leading air cargo employer, decreased employment by 1,843 jobs.
Scheduled passenger airlines gained 2,890 full-time equivalents in May 2026
U.S. Airline Full-Time Equivalents (FTEs)
BTS calculates FTEs by dividing the number of part-time employees by 2 and adding that figure to the number of full-time employees. The May 2026 industry-wide numbers include 756,765 full-time and 281,492 part-time workers for a total of 897,511 FTEs, an increase from April of 2,367 FTEs (0.26%).
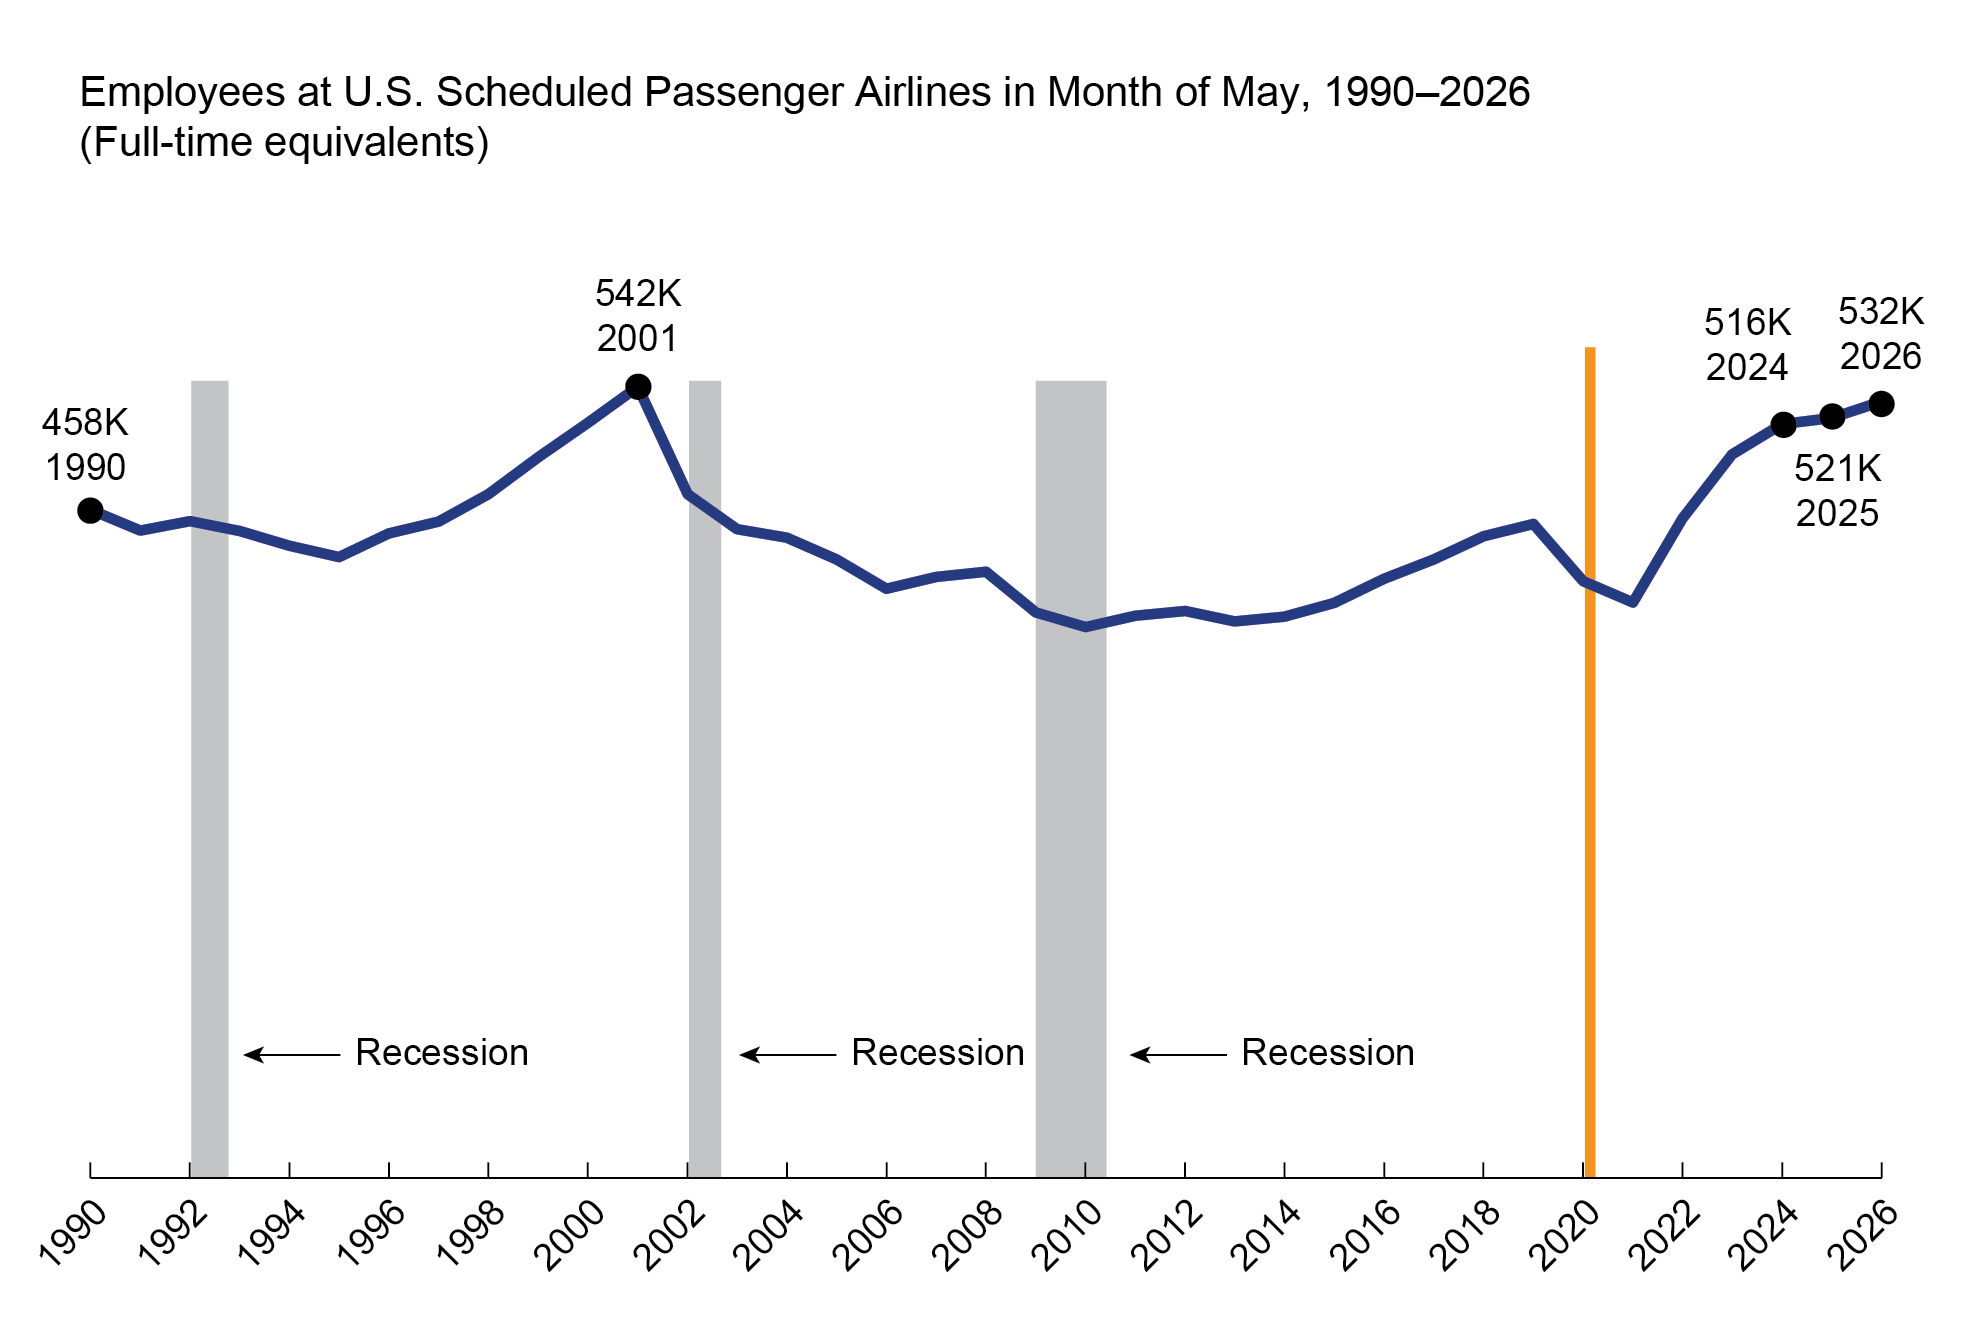
The 24 U.S. scheduled passenger airlines reporting data for May 2026 employed 531,996 FTEs, 2,890 FTEs (0.55%) more than in April 2026. Data by passenger carrier category can be found in the accompanying tables.
U.S. cargo airlines employed 361,170 FTEs in May 2026, down 544 FTEs (0.15%) from April 2026.
Reporting Notes
Data is compiled from monthly reports filed with BTS by commercial air carriers as of July 10, 2026. Additional airline employment data and previous releases can be found on the BTS website. The month-to-month numbers are not seasonally adjusted.
Passenger, cargo, and charter airlines that operate at least one aircraft that has more than 60 seats or the capacity to carry a payload of passengers, cargo, and fuel weighing more than 18,000 pounds must report monthly employment statistics. Regulations require U.S. airlines to report employment numbers for employees who worked or received pay for any part of the pay period(s) ending nearest the 15th day of the month.
See the tables that accompany this release on the BTS website for detailed data (Tables 1-15) and industry summary monthly data since 1990. Additional individual airline numbers are available on the BTS airline employment web page. The web page provides full-time and part-time employment numbers by carrier by month from 1990 through May 2026.
The next update for U.S. airline employment is scheduled for Tuesday, August 11, 2026.
To receive updates from BTS directly to your email, please consider subscribing to our GovDelivery service.