
U.S. International Air Cargo Rose Slightly in July 2020 from July 2019 (Preliminary)
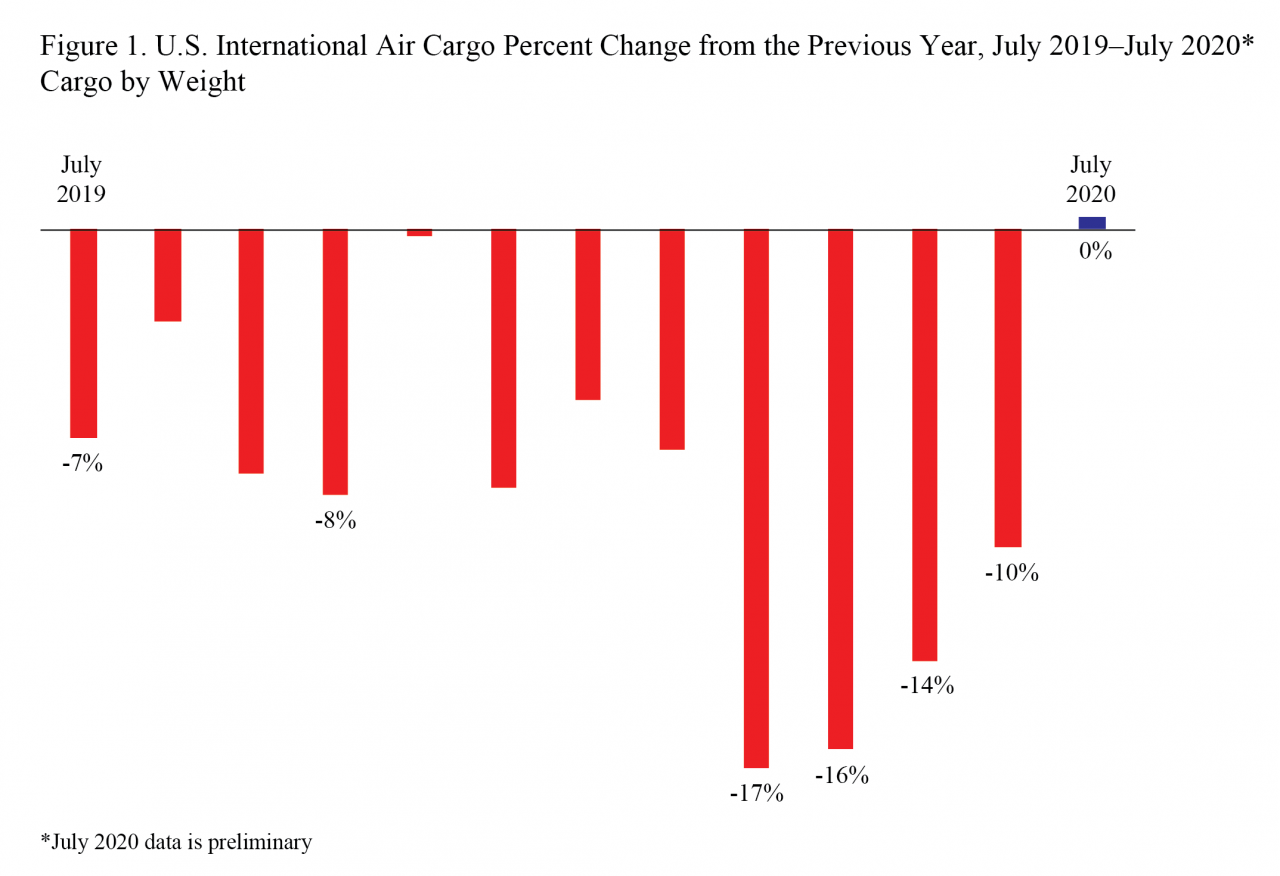
U.S. and foreign airlines carried 0.4% more cargo by weight between the U.S. and foreign points in July 2020 than in July 2019, including a 19% rise in cargo between the U.S. and Asia, according to data filed with the Bureau of Transportation Statistics (BTS) by large air carriers. July’s 0.4% increase followed year-over-year decreases in March (down 17%), April (down 16%), May (down 14%) and June (down 10%).
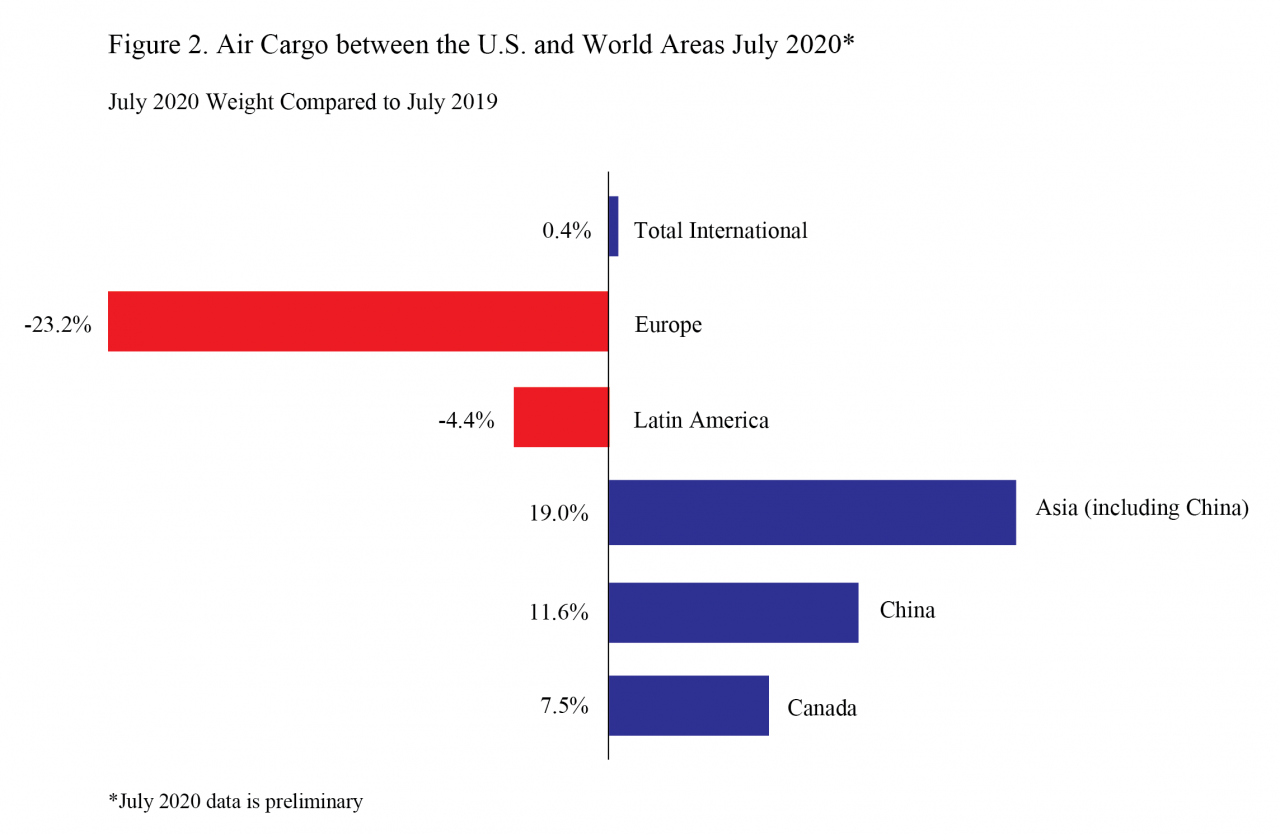
July 2020 (preliminary) cargo numbers to and from the U.S. by world geographic areas (by weight):
- Total to and from the U.S.: 727 thousand tons, up 0.4% from July 2019 (724T tons)
- Europe: 160 thousand tons, down 23.2% from July 2019 (208T tons)
- Latin America: 104 thousand tons, down 4.4% from July 2019 (109T tons)
- Asia (including China): 408 thousand tons, up 19.0% from July 2019 (343T tons)
- China: 91 thousand tons, up 11.6% from July 2019 (81T tons)
- Canada: 24.6 thousand tons, up 7.5% from July 2019 (22.9T tons)
The total to and from the U.S. includes world areas that are not shown separately.
Air cargo reports are filed monthly with BTS. Final July data will be released on Oct. 16. Cargo data in this release are limited to shipments between the U.S. and foreign points. Due to confidentiality requirements, public access to international origin and destination data of U.S. and foreign air carriers is restricted for a period of six months from the data date. Complete international data will be released in January. Numbers in this release are based on world area codes.
Total Air Cargo to and from the U.S.
The 0.4% rise (preliminary) between July 2019 and July 2020 in the weight of cargo carried on U.S. and foreign airlines between the U.S. and foreign points was the first month without an annual decline since October 2018. Annual declines with Europe (down 23.2%) and Latin America (down 4.4%) were less than those in the previous four months. These declines offset the year-to-year rise in Asia (up 19.0%), the region with most U.S.-based cargo. The Asian cargo increases primarily took place outside of China where there was a smaller 11.6% rise in cargo with the U.S.
| 2016-2017 | 2017-2018 | 2018-2019 | 2019-2020 | |
|---|---|---|---|---|
| January | 8.5 | 13.8 | -2.2 | -5.4 |
| February | 8.0 | 13.6 | -5.4 | -7.0 |
| March | 10.2 | 11.6 | -1.9 | -17.0 |
| April | 7.1 | 11.6 | -8.2 | -16.5 |
| May | 12.5 | 11.3 | -6.2 | -13.7 |
| June | 12.1 | 8.6 | -6.8 | -10.1 |
| July | 13.5 | 3.2 | -6.6 | 0.4* |
| August | 13.6 | 5.1 | -2.9 | |
| September | 10.0 | 5.7 | -7.7 | |
| October | 12.2 | 2.0 | -8.4 | |
| November | 17.9 | -9.4 | -0.2 | |
| December | 14.1 | -1.7 | -8.1 | |
| Annual | 11.8 | 5.7 | -5.4 |
Source: Bureau of Transportation Statistics, T-100 International Market (All Carriers)
* July 2020 data is preliminary
See the tables that accompany this release on the BTS website for year-to-year changes since 2017 for Europe, Latin America, Asia (including China), China and Canada.
Europe
U.S.-Europe cargo declined 23.2% (preliminary) from July 2019 following larger declines in April (42.9%), May (37.7%) and June (32.8%). The annual decline in July was the smallest since February.
Latin America
Cargo traffic with Latin America declined 4.4% (preliminary) from July 2019 following larger annual declines in May (22.7%) and June (8.0%). The July decline was the smallest since January (0.9%).
Asia (including China)
The July annual increase of 19.0% (preliminary) of cargo with Asia (including China) was the fourth consecutive rise beginning in April. The July increase was the largest since February 2018. Asia cargo comprised 56% of total U.S. international air cargo in July.
China
The 11.6% rise in U.S.-China air cargo shipments from July 2019 to July 2020, was the second consecutive increase from the previous year following a rise in June (7.3%). Before the 0.1% drop in May, U.S.-China air cargo decreased by at least 10% from the same month of the previous year for four consecutive months. During July 2020, 85.8% of the cargo was from China to the U.S. while 14.2% was from the U.S. to China.
Canada
The 7.5% (preliminary) year-to-year increase in the weight of cargo carried on U.S. and foreign airlines between the U.S. and Canada in July was the second consecutive month with an annual increase following four consecutive year-to-year decreases. During July 2020, 38.9% of the cargo was from Canada to the U.S. while 61.1% was from the U.S. to Canada.
Reporting Notes
Data are compiled from monthly reports filed with BTS by commercial U.S. air carriers detailing operations, passenger traffic and cargo traffic. This release includes data received by BTS from 34 U.S. and foreign airlines as of Sept. 10.
See the BTS Airlines and Airports page for additional U.S. airlines numbers through June for U.S. airlines. International data by origin and destination is available through March.
None of the data are from samples. Measures of statistical significance do not apply to the complete air traffic data.