
U.S. Scheduled Passenger Airlines employed 1.3K more employees in June 2021 than in May 2021
BTS 51-21
Contact: Todd Solomon
Tel: 202-366-0573
todd.solomon@dot.gov
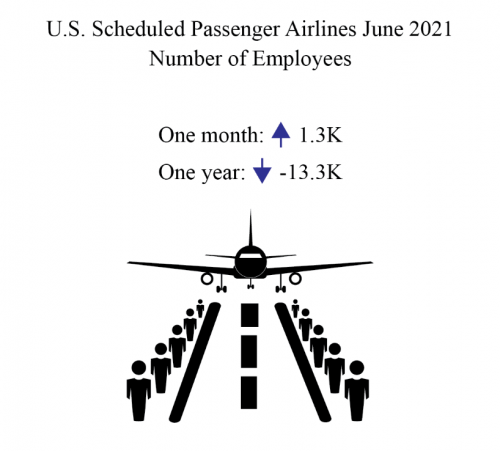
The 24 U.S. scheduled passenger airlines employed 0.3% more full-time equivalents (FTEs) in June 2021 than in May 2021:
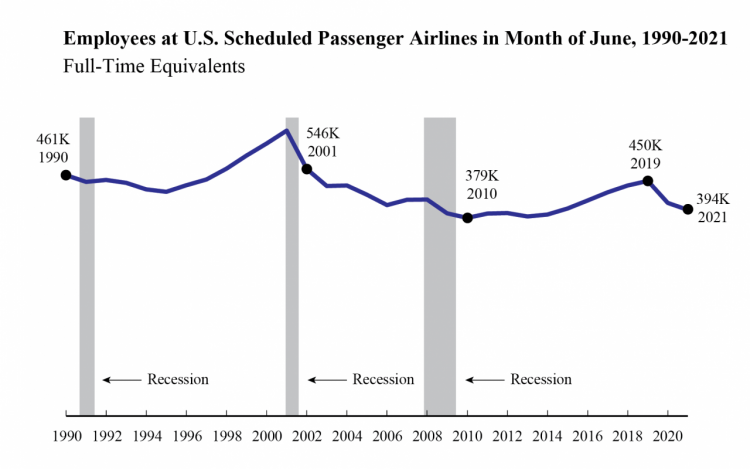
- June’s total number of FTEs (394,298) was up 1,314 from May (392,984) and down 62,962 from the onset of the pandemic in March 2020 (457,260), a 13.8% drop.
- May 2021 was the lowest FTE total for the month of May since 2015 (396,973).
The increase from May resulted largely from American Airlines adding 1,039 FTEs and United Airlines adding 296 FTEs. Only three reporting airlines reduced FTEs (Southwest, Skywest, and Horizon) from May to June.
In June 2021, scheduled passenger airlines employed 56% of total airline industry FTEs, down from 63% in March 2020. Total industry includes cargo and charter carriers.
Regulations require U.S. airlines to report employment numbers for employees who worked or received pay for any part of the pay period(s) ending nearest the 15th day of the month. U.S. airline employment reports are filed monthly with the Bureau of Transportation Statistics. See the tables that accompany this release on the BTS website for detailed data since 2015 (Tables 1-15) and industry summary monthly data since 1990.
All 24 scheduled service passenger airlines (mid-June)
- 394,298 FTEs
- Down 3.3% (13,395 FTEs) from June 2020 (407,693 FTEs)
- Down 7.8% (33,520 FTEs) from June 2017 (427,818 FTEs)
Four network airlines (mid-June)
American Airlines, Delta Air Lines, United Airlines, Alaska Airlines
- 238,455 FTEs, 60.5% of total scheduled passenger airline FTEs
- Down 3.3% (8,095 FTEs) from June 2020 (246,550 FTEs)
- Down 14.3% (39,935 FTEs) from June 2017 (278,390 FTEs)
- Up 0.6% (1,384 FTEs) from May 2021 (237,071) FTEs
Network airlines operate a significant portion of their flights using at least one hub where connections are made for flights to down-line destinations or spoke cities. Note that beginning with January 2018 data, Virgin America’s numbers are included with Alaska Airlines in the network category.
Six low-cost airlines (mid-June)
Southwest Airlines, JetBlue Airways, Spirit Airlines, Frontier Airlines, Allegiant Air, Virgin America
- 89,859 FTEs, 22.8% of total scheduled passenger airline FTEs
- Down 8.7% (8,524 FTEs) from June 2020 (98,383 FTEs)
- Up 0.5% (467 FTEs) from June 2017 (89,392 FTEs)
- Down 0.2% (188 FTEs) from May 2021 (90,047) FTEs
Low-cost airlines operate under a low-cost business model, with infrastructure and aircraft operating costs below the overall industry average.
Ten regional airlines (mid-June)
SkyWest Airlines, Envoy Air, Piedmont Airlines, Republic Airlines, Endeavor Air, PSA Airlines, Horizon Air, Mesa Airlines, Air Wisconsin Airlines, GoJet Airlines
- 57,970 FTEs, 14.7% of total scheduled passenger airline FTEs
- Up 8% (4,317 FTEs) from June 2020 (53,653 FTEs)
- Up 11.2% (5,826 FTEs) from June 2017 (52,144 FTEs)
- Up 0.1% (73 FTEs) from May 2021 (57,897 FTEs)
Regional carriers typically provide service from small cities, using primarily regional jets to support the network carriers’ hub and spoke systems.
Top Employers by Group
- Network: American 93,229 FTEs
- Low-Cost: Southwest 54,448 FTEs
- Regional: SkyWest 13,786 FTEs
Group totals will not add up to industry totals because four other airlines are included in industry totals. These carriers generally operate within specific niche markets. They are Hawaiian Airlines, Sun Country Airlines, Silver Airlines and Eastern Airlines.
Reporting Notes
Airlines that operate at least one aircraft that has more than 60 seats or the capacity to carry a payload of passengers, cargo and fuel weighing more than 18,000 pounds must report monthly employment statistics.
Data are compiled from monthly reports filed with BTS by commercial air carriers as of Aug 5. Additional airline employment data and previous releases can be found on the BTS website. BTS has scheduled release of July 2021 passenger airline employment data for September 20.