Freight Facts and Figures
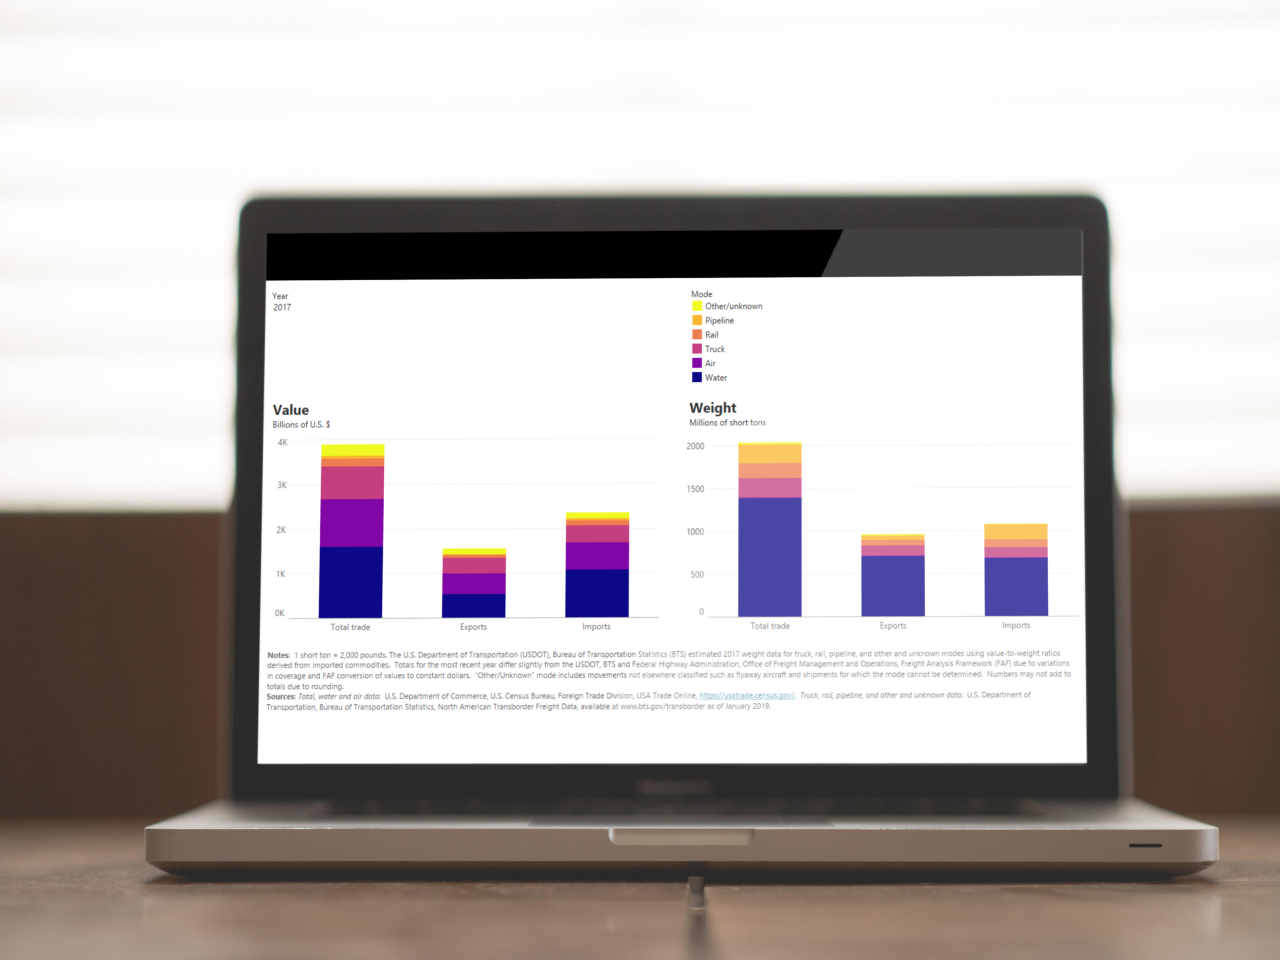
Freight Facts and Figures, developed by the Bureau of Transportation Statistics, is a collection of charts and statistical tables about freight transportation in the United States. These interactive visualizations and tables provide a snapshot of freight movement; the extent, condition, and performance of the freight transportation system; the economic implications of freight movement; and the safety, energy, and environmental impacts of freight transportation.
We introduce this new digital version of Freight Facts and Figures. In these stories, we continue to release the statistics contained in the annual publication that has been produced since 2004. The new format features interactive charts and tables, open and accessible data, and regular updates to the content.
BTS strives to continually improve Freight Facts and Figures. If you have a suggestion on how to make this product better, find an issue, or have a question, please contact us at Ask A Librarian. We welcome your feedback.
View Freight Facts and Figures