
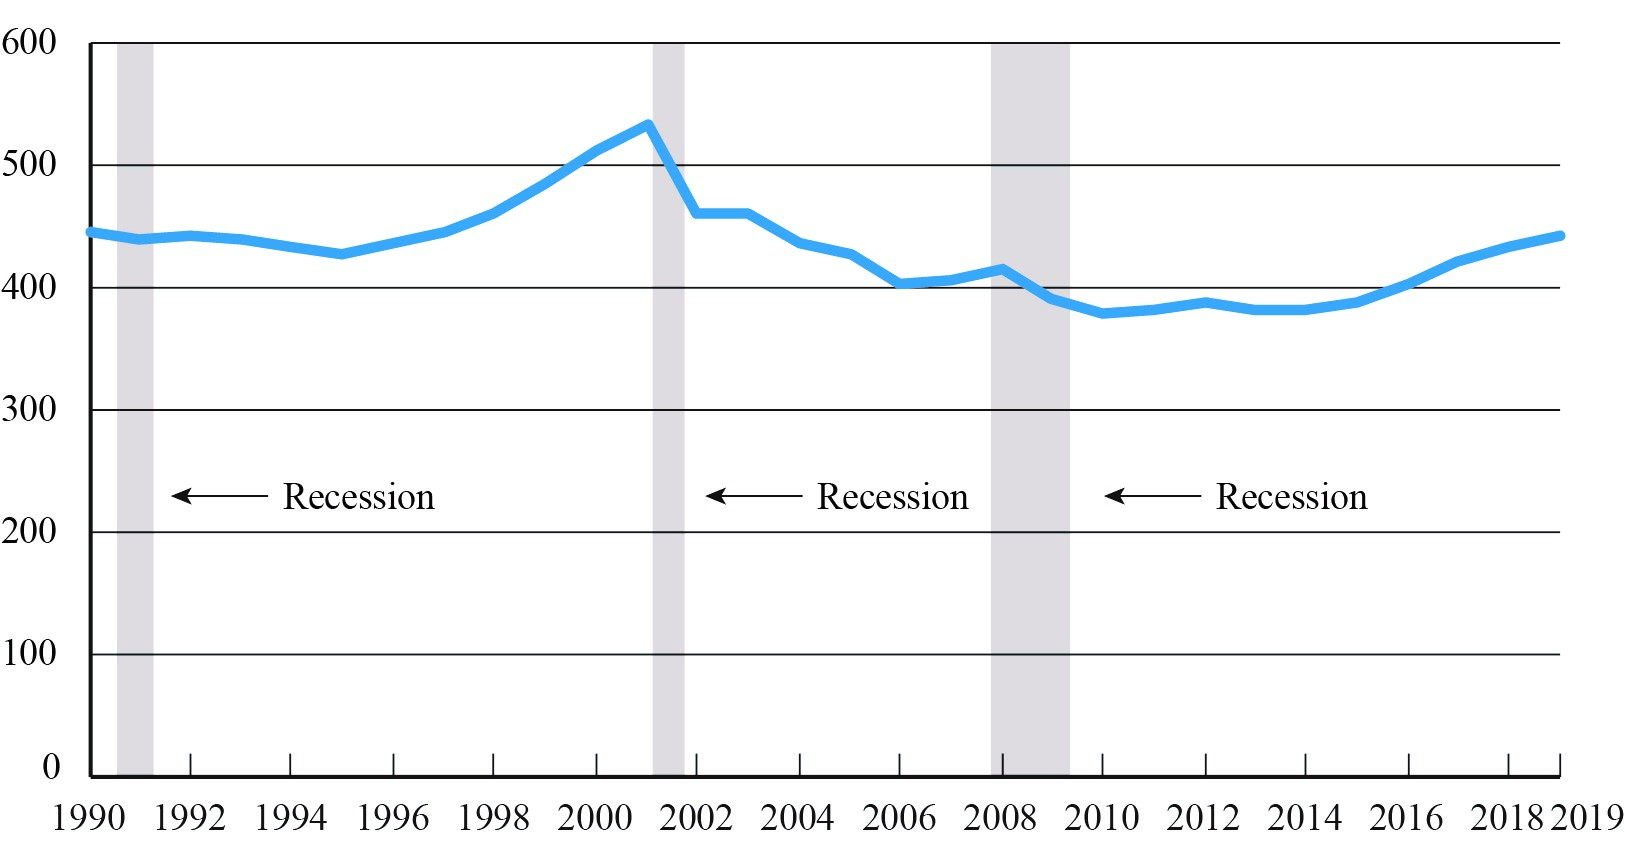
Scheduled Passenger Airline Full-Time Equivalent Employees, Month of February, 1990-2019
February FTEs in thousands (000)
Figure
Dataset Table:
| Year | February FTEs in thousands (000) | 1 |
|---|---|---|
| 1990 | 446.6 | 2 |
| 1991 | 440.6 | 3 |
| 1992 | 442.9 | 4 |
| 1993 | 439.8 | 5 |
| 1994 | 434.3 | 6 |
| 1995 | 428.3 | 7 |
| 1996 | 435.2 | 8 |
| 1997 | 446.1 | 9 |
| 1998 | 461.1 | 10 |
| 1999 | 483.8 | 11 |
| 2000 | 511.0 | 12 |
| 2001 | 534.6 | 13 |
| 2002 | 461.0 | 14 |
| 2003 | 460.9 | 15 |
| 2004 | 435.5 | 16 |
| 2005 | 427.4 | 17 |
| 2006 | 402.8 | 18 |
| 2007 | 406.2 | 19 |
| 2008 | 415.4 | 20 |
| 2009 | 391.6 | 21 |
| 2010 | 378.6 | 22 |
| 2011 | 382.1 | 23 |
| 2012 | 387.2 | 24 |
| 2013 | 380.4 | 25 |
| 2014 | 382.0 | 26 |
| 2015 | 389.0 | 27 |
| 2016 | 403.9 | 28 |
| 2017 | 419.8 | 29 |
| 2018 | 432.2 | 30 |
| 2019 | 443.1 | 31 |
| 32 |
Notes:
FTE calculations count two part-time employees as one full-time employee.
Source:
Bureau of Transportation Statistics