
Intermodal
Legacy ID
1521
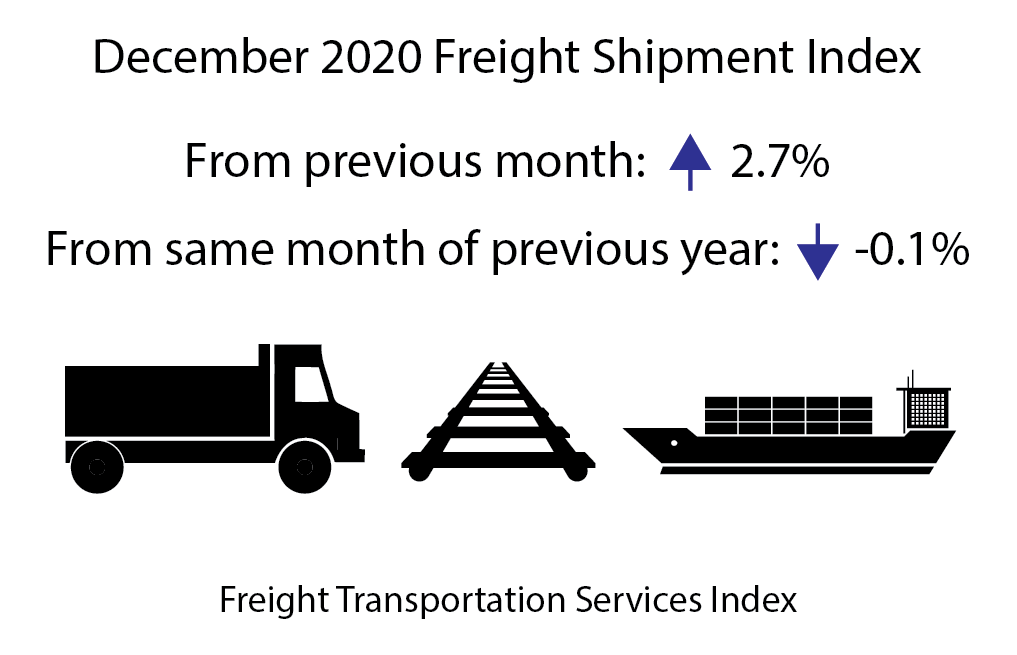
December 2020 Freight Transportation Services Index (TSI) Rose to Highest Level since Start of Pandemic
Release Number: BTS 09-21
Transportation Statistics Annual Report 2020
Wednesday, December 23, 2020 – The 26th edition of the Transportation Statistics Annual Report (TSAR), a congressionally-mandated report, is now available from the Bureau of Transportation Statistics (BTS). TSAR 2020 presents key transportation indicators along with an overview of the transportation system. It also includes data and statistics on passenger travel, freight movement, transportation and the economy, system reliability, safety, and energy use and environmental impacts of transportation.
October 2020 Freight Transportation Services Index (TSI) Rose Slightly
The Freight Transportation Services Index (TSI), which is based on the amount of freight carried by the for-hire transportation industry, rose 0.1% in October from September, rising for the second consecutive month, according to the U.S. Department of Transportation’s Bureau of Transportation Statistics’ (BTS). From October 2019 to October 2020 the index fell 4.5% compared to a decline of 0.6% from October 2018 to October 2019 and a rise of 6.8% from October 2017 to October 2018 (Tables 1, 2, and 2A).