
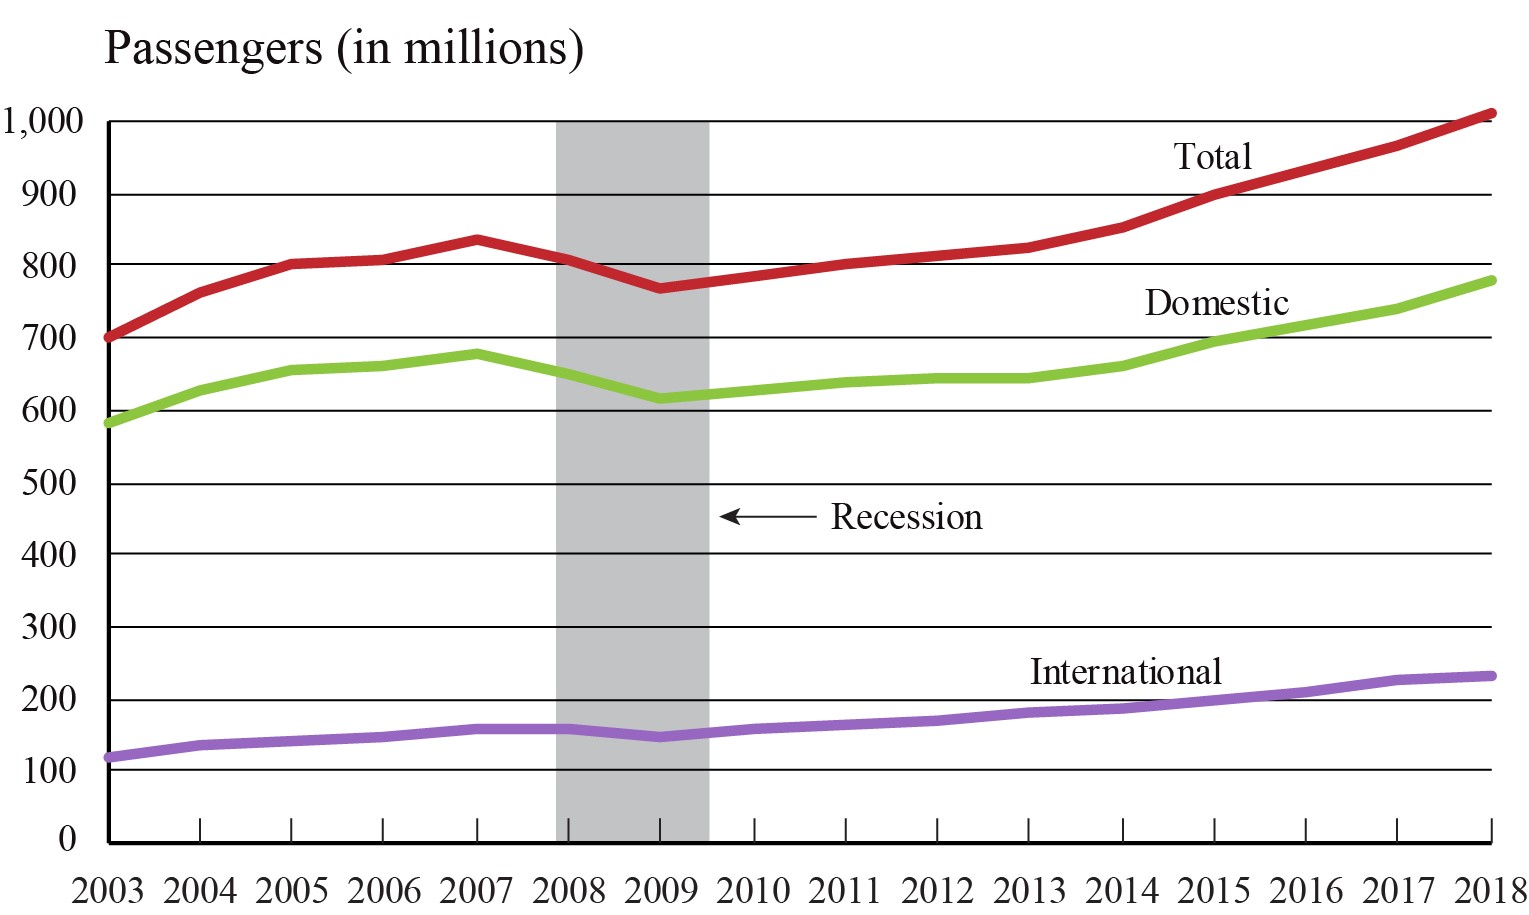
Annual Passengers on All U.S. Scheduled Airline Flights (Domestic & International) and Foreign Airline Flights to and from the United States, 2003-2018
Figure
Dataset Table:
| Year | Total | Domestic | International | 1 |
|---|---|---|---|---|
| 2003 | 700.9 | 583.3 | 117.6 | 2 |
| 2004 | 763.7 | 629.8 | 133.9 | 3 |
| 2005 | 800.8 | 657.3 | 143.6 | 4 |
| 2006 | 808.1 | 658.4 | 149.7 | 5 |
| 2007 | 835.5 | 679.2 | 156.3 | 6 |
| 2008 | 809.8 | 651.7 | 158.1 | 7 |
| 2009 | 767.8 | 618.1 | 149.7 | 8 |
| 2010 | 787.5 | 629.5 | 157.9 | 9 |
| 2011 | 802.1 | 638.2 | 163.9 | 10 |
| 2012 | 813.1 | 642.3 | 170.8 | 11 |
| 2013 | 825.3 | 645.7 | 179.6 | 12 |
| 2014 | 851.8 | 662.8 | 189.0 | 13 |
| 2015 | 896.6 | 696.0 | 200.6 | 14 |
| 2016 | 932.0 | 720.0 | 212.0 | 15 |
| 2017 | 965.4 | 741.7 | 223.7 | 16 |
| 2018 | 1,011.5 | 777.9 | 233.6 | 17 |
| 18 |
Source:
Bureau of Transportation Statistics, T-100 Market (All Carriers)