
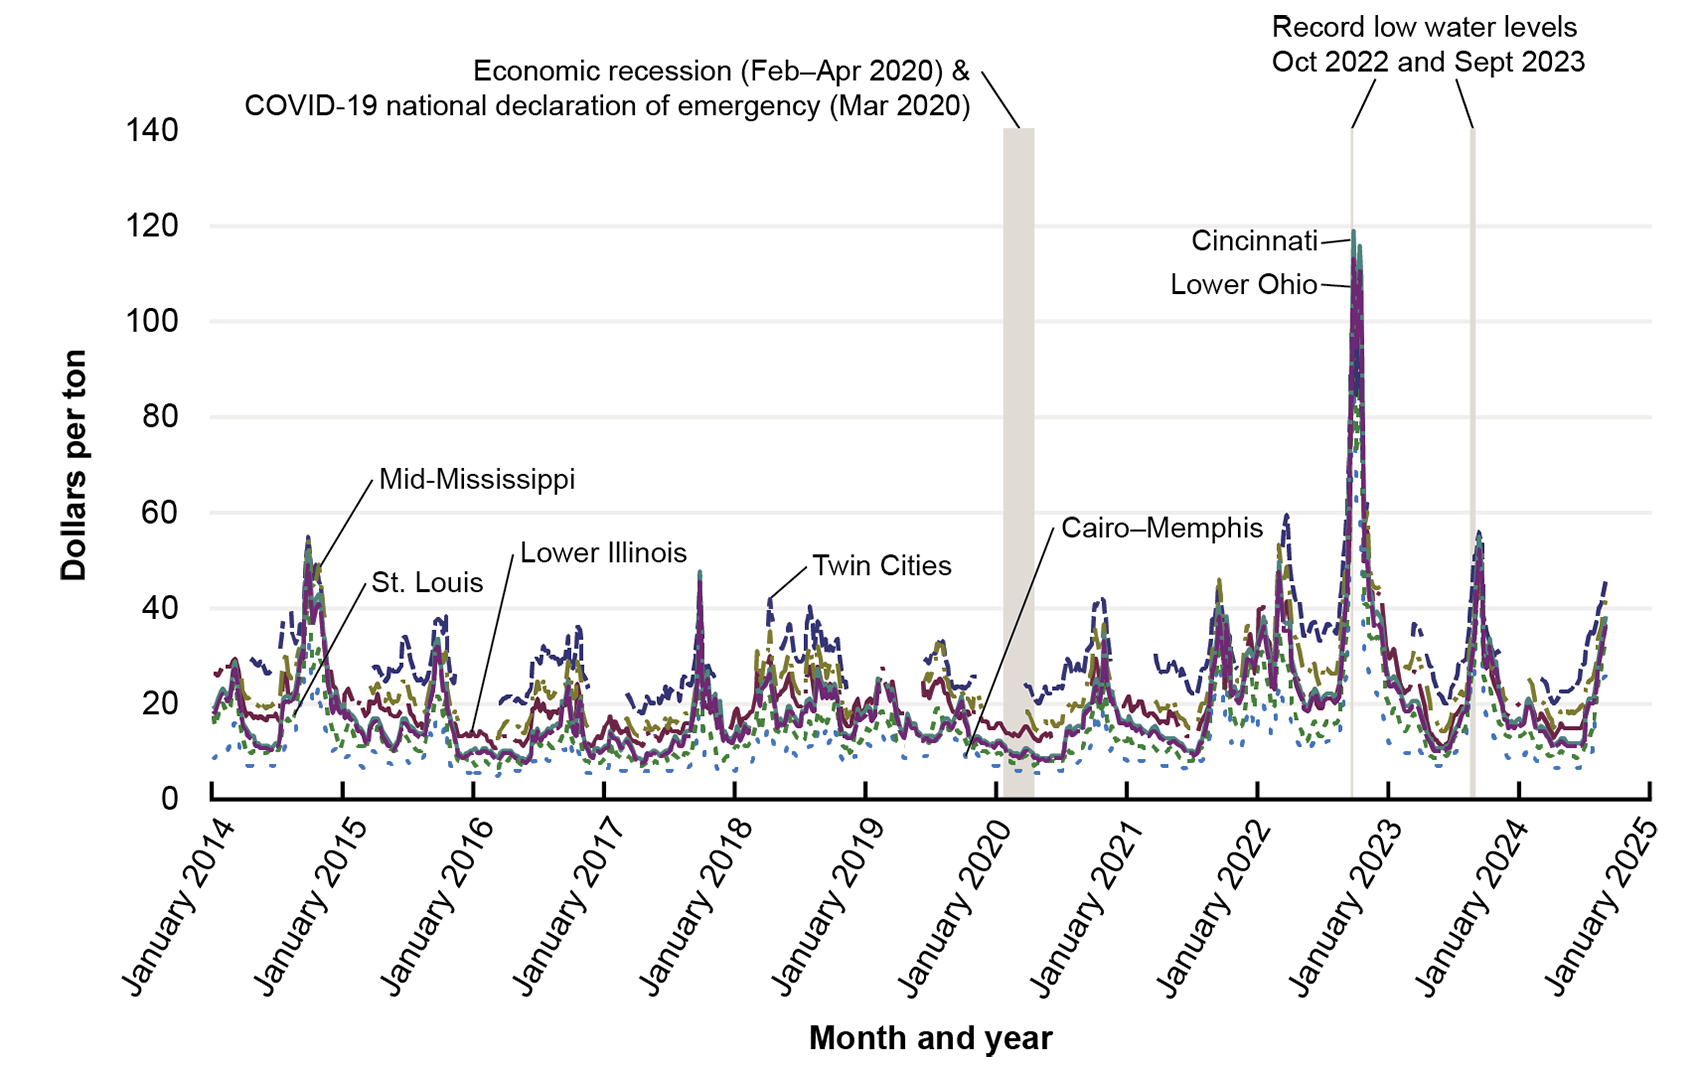
Downbound Grain Barge Rates (Dollars per Ton): January 2014–September 2024
Figure
Dataset Excel:
F4_20_Barge_rates.xlsx (554.11 KB)Notes:
Weekly barge rates for downbound freight originating from seven locations along the Mississippi River System, which includes the Mississippi River and its tributaries (e.g., Upper Mississippi River, Illinois River, Ohio River). The seven locations are: (1) “Twin Cities,” a stretch along the Upper Mississippi; (2) “Mid-Mississippi,” a stretch between eastern Iowa and western Illinois; (3) “Illinois River,” along the lower portion of the Illinois River; (4) “St. Louis”; (5) “Cincinnati,” along the middle third of the Ohio River; (6) “Lower Ohio,” approximately the final third of the Ohio River; and (7) “Cairo Memphis,” from Cairo, IL, to Memphis, TN. Under the percent-of-tariff system, each city on the river has its own benchmark, with the northern most cities having the highest benchmarks. They are as follows: Twin Cities = 619; Mid Mississippi = 532; St. Louis = 399; Illinois = 464; Cincinnati = 469; Lower Ohio = 446; and Cairo-Memphis = 314. Breaks in the lines indicate no rate record for that week at that location.
Description:
This bar chart is from the 2024 Transportation Statistics Annual Report.
Source:
United States Department of Agriculture, Downbound Grain Barge Rates, available at https://agtransport.usda.gov/Barge/Downbound-Grain-Barge-Rates/deqi-uken as of September 2024.