
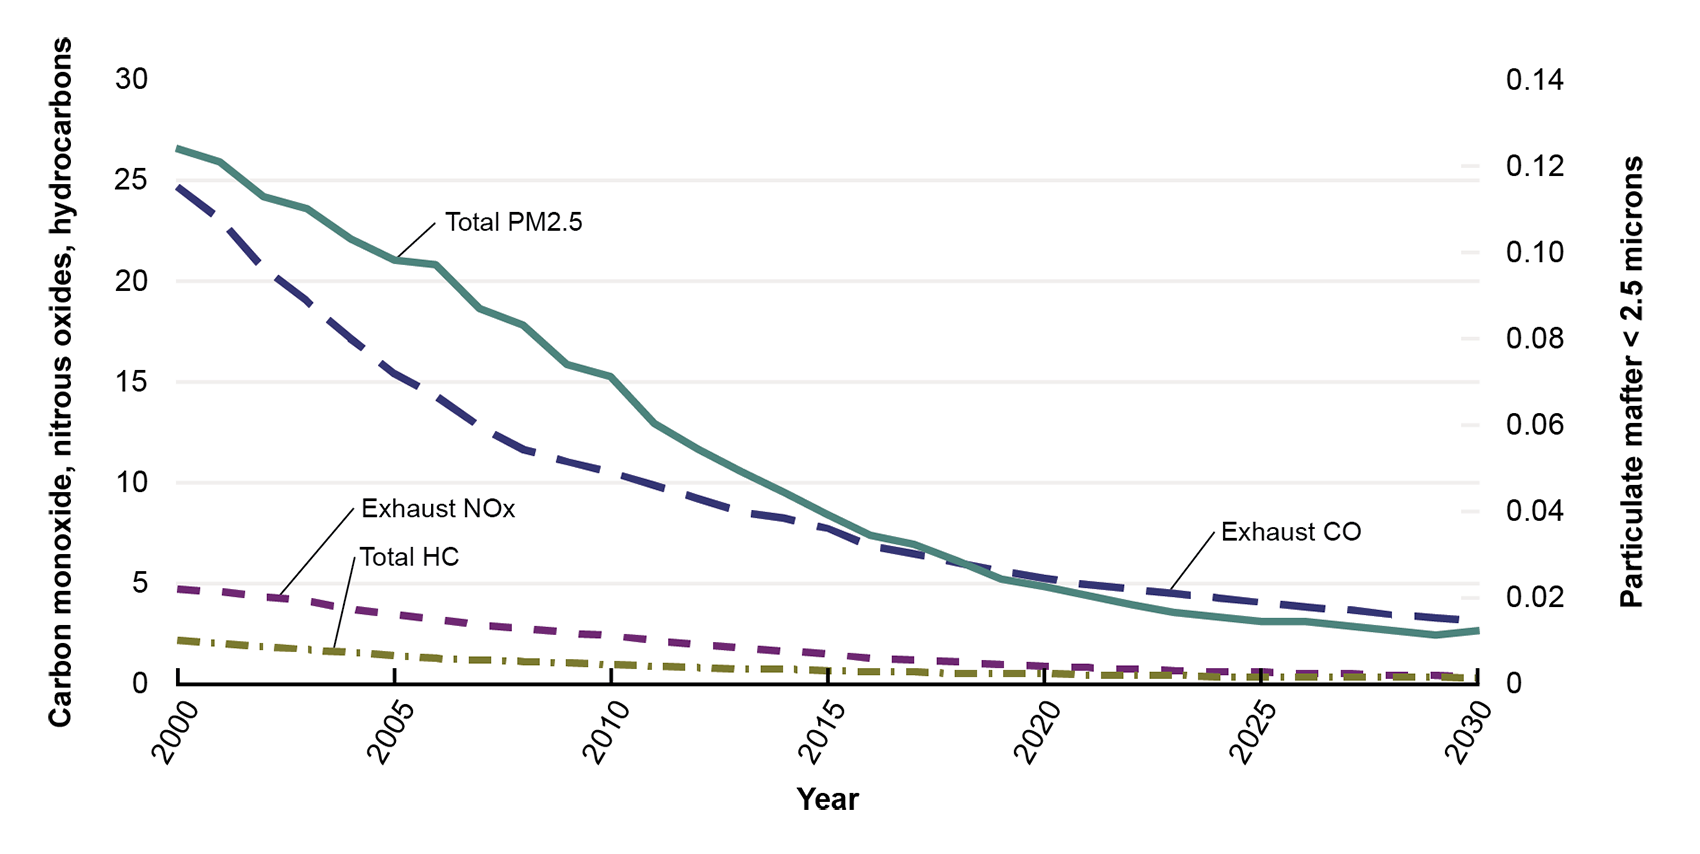
Estimated National Average per Vehicle Using Gasoline and Diesel by Pollutant: 2000–2030
Figure
Dataset Excel:
F6-21 Vehicle Average per Vehicle using gasoline and disel by pollutant 2000-2030.xlsx (28.87 KB)Notes:
Estimates are by calendar year. Vehicle types are defined as follows: light-duty vehicles (passenger cars); light-duty trucks (two axle, four tire); buses (school, transit and other); heavy duty vehicles (trucks with more than two axles or four tires); motorcycle (highway only). Emissions factors are averages based on the national average age distributions, vehicle activity (speeds, operating modes, vehicle-miles traveled fractions, starts and idling), temperatures, humidity, inspection/maintenance and antitampering programs, and average gasoline fuel properties in that calendar year. Gasoline-electric hybrids are accounted for in the values for gasoline vehicles. This table was generated using MOVES4, the U.S. Environmental Protection Agency’s mobile source emissions factor model. More information on MOVES is available at www.epa.gov/moves. Data for this update are based on new estimation models and are not comparable to previous releases. MOVES4 includes updates to historical data and methods as well as updates to future year projections and thus provides the current best estimates of emissions for all calendar years. Inputs for 2022 and later are projections.
CO = carbon monoxide; PM = particulate matter; NOx = nitrogen oxides; HC = hydrocarbons.
Description:
This table is from the 2024 Transportation Statistics Annual Report.
Source:
U.S. Environmental Protection Agency, Office of Transportation and Air Quality, personal communication, June 21, 2024.