USA Banner

Official US Government Icon

Official websites use .gov
A .gov website belongs to an official government organization in the United States.

Secure Site Icon

Secure .gov websites use HTTPS
A lock ( ) or https:// means you’ve safely connected to the .gov website. Share sensitive information only on official, secure websites.

U.S. Department of Transportation U.S. Department of Transportation Icon United States Department of Transportation United States Department of Transportation

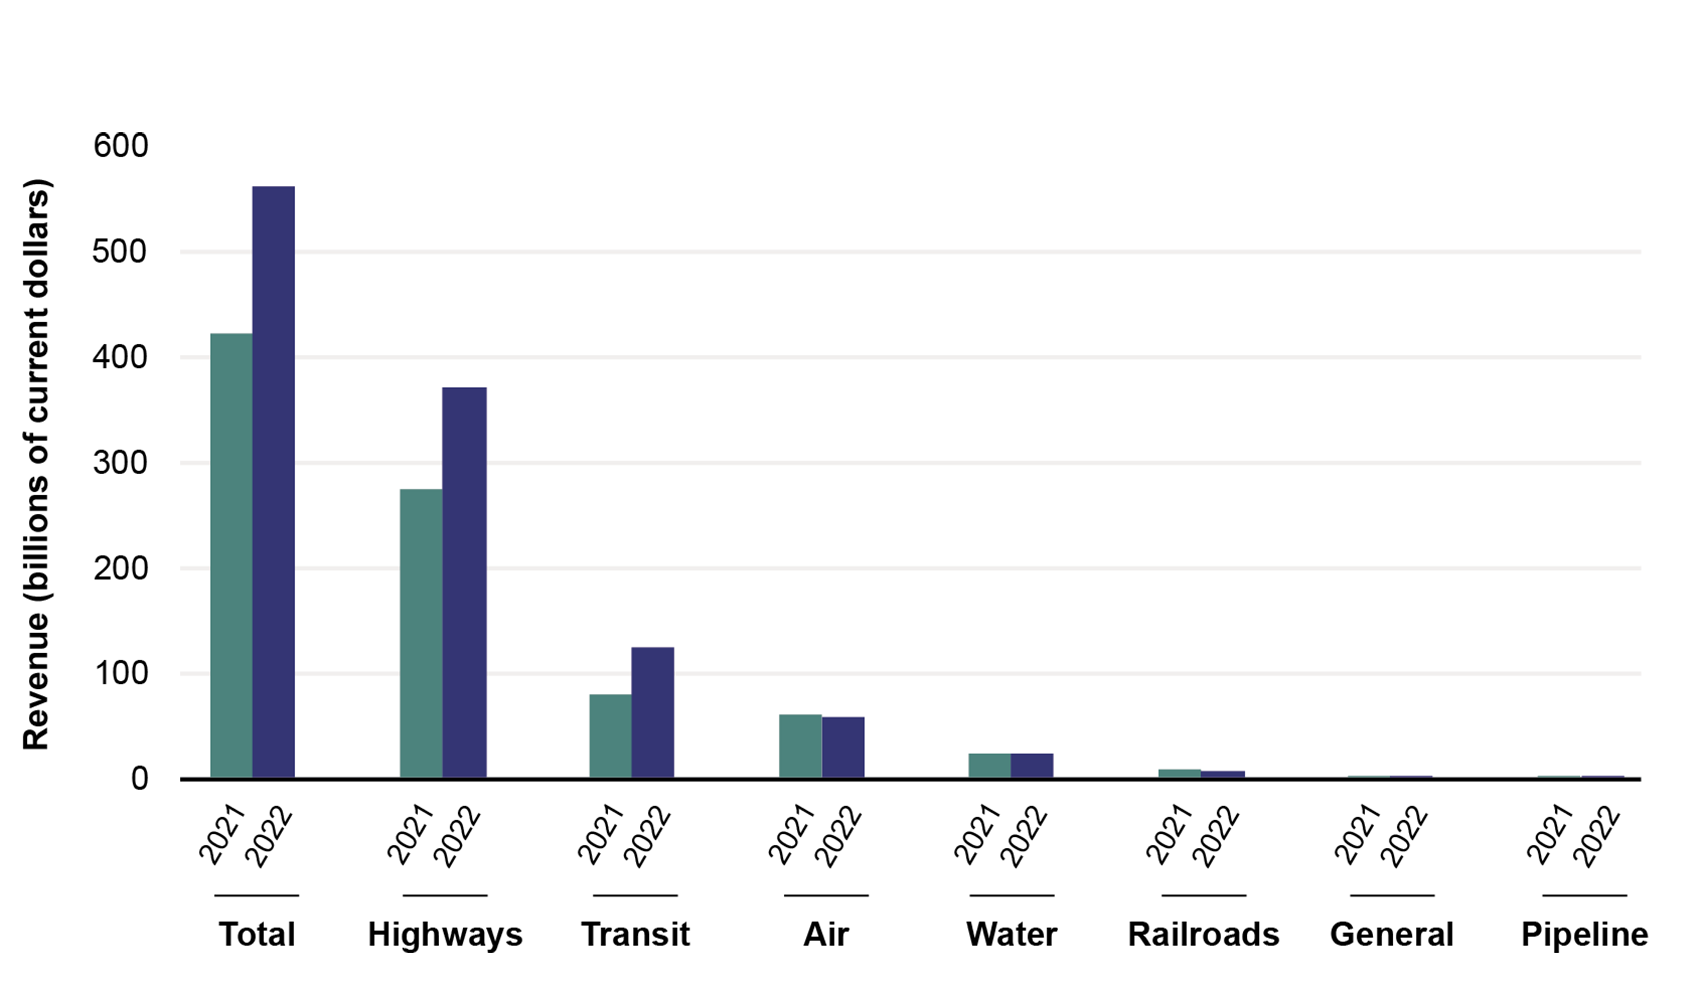
Federal, State, and Local Transportation Revenue by Mode: 2021 and 2022

Figure

This bar graph shows federal, state, and local transportation expenditures for highways, transit, air, water, railroads, general, and pipeline. Total expenditures were 417.1 billion dollars in 2021 and 555.2 billion dollars in 2022. Highways have the highest transportation expenditures. In 2021, expenditures for highways were 270.6 billion dollars or 65 percent of total expenditures. In 2022, expenditures for highways were 366.1 billion dollars or 66 percent.

Dataset Excel:

F4_12_FederalRevenue_Mode.xlsx (47.06 KB)

Notes:

Highways includes user-based-transit revenue but is excluded from the total, which already contains these transit revenues, to avoid double counting.

Description:

This bar chart is from the 2024 Transportation Statistics Annual Report.

Source:

U.S. Department of Transportation, Bureau of Transportation Statistics, Government Transportation Financial Statistics, available at https://www.bts.gov/tpfs as of September 2024.

Publications: