USA Banner

Official US Government Icon

Official websites use .gov
A .gov website belongs to an official government organization in the United States.

Secure Site Icon

Secure .gov websites use HTTPS
A lock ( ) or https:// means you’ve safely connected to the .gov website. Share sensitive information only on official, secure websites.

U.S. Department of Transportation U.S. Department of Transportation Icon United States Department of Transportation United States Department of Transportation

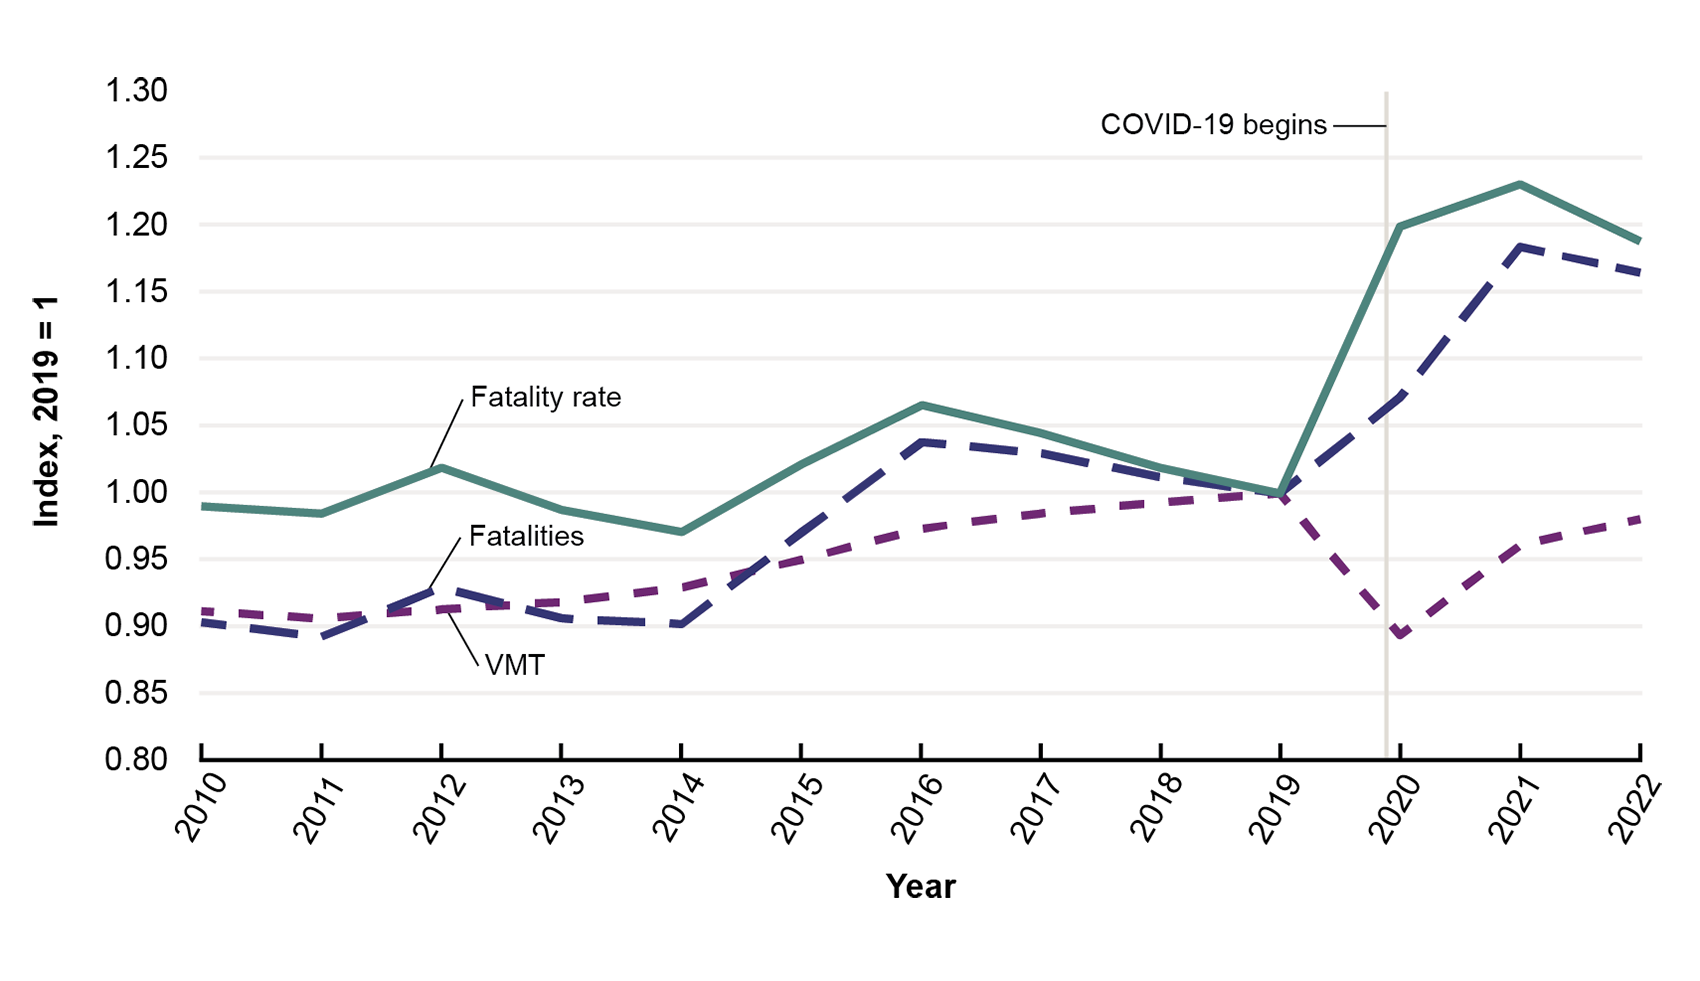
Indices of Motor Vehicle–Related Fatalities, VMT, and Fatality Rates Before and During COVID-19: 2010–2022

Figure

This line graph illustrates motor vehicle–related fatalities, vehicle miles traveled (VMT), and fatality rates before and during COVID-19. The x-axis represents year and ranges from 2010 through 2022. The y-axis represents index (where 2019 equals 1) and ranges from 0.80 through 1.30. Fatality rate begins at an index just below 1.00, peaks at about 1.07 in 2016, dips back down to 1.00 in 2019, and sharply increased to 1.20 shortly after the start of COVID-19 in 2020. After COVID-19, the fatality rate contin

Description:

This table is from the 2024 Transportation Statistics Annual Report.

Source:

2019–2022: U.S. Department of Transportation, National Highway Traffic Administration. Overview of Motor Vehicle Crashes in 2022. June 2024 (Revised) DOT HS 813 560. 2010 2018: U.S. Department of Transportation, Bureau of Transportation Statistics, National Transportation Statistics, tables 1-35, 2-1, and 2-7.

Publications: