
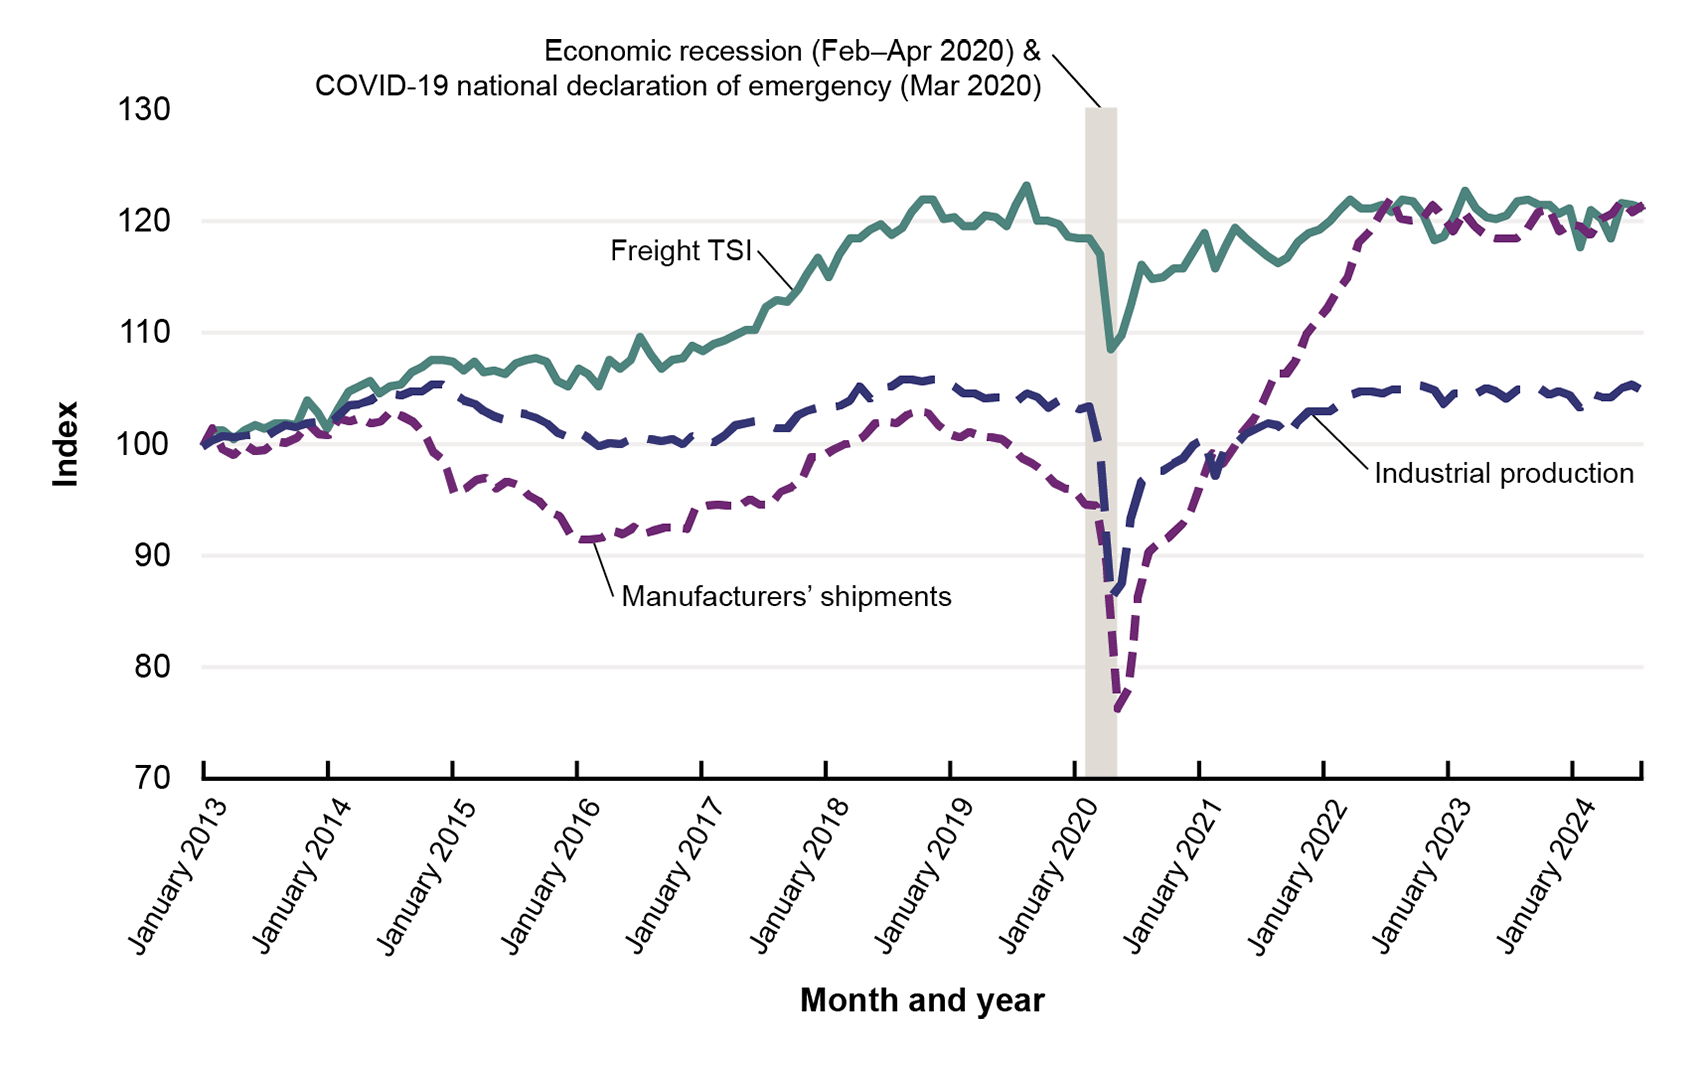
Industrial Production, Manufacturers’ Shipments, and Freight Transportation Services Index: January 2013–July 2024
Key: TSI = Transportation Services Index
Figure
Dataset Excel:
F4_03_TSI_Freight_IP_MNF_A.xlsx (107.12 KB)Description:
This graph is from the 2024 Transportation Statistics Annual Report.
Source:
Industrial Production: Board of Governors of the Federal Reserve System, Industrial Production Index [INDPRO], retrieved from FRED, Federal Reserve Bank of St. Louis https://research.stlouisfed.org/fred2/series/INDPRO/ as of September 2024. Manufacturers’ Shipments: U.S. Bureau of the Census, Value of Manufacturers’ Shipments for All Manufacturing Industries [AMTMVS], retrieved from FRED, Federal Reserve Bank of St. Louis https://research.stlouisfed.org/fred2/series/AMTMVS/ as of September 2024. Freight TSI: U.S. Department of Transportation, Bureau of Transportation Statistics, Transportation Services Index, available at www.transtats.bts.gov/OSEA/TSI/ as of September 2024.