USA Banner

Official US Government Icon

Official websites use .gov
A .gov website belongs to an official government organization in the United States.

Secure Site Icon

Secure .gov websites use HTTPS
A lock ( ) or https:// means you’ve safely connected to the .gov website. Share sensitive information only on official, secure websites.

U.S. Department of Transportation U.S. Department of Transportation Icon United States Department of Transportation United States Department of Transportation

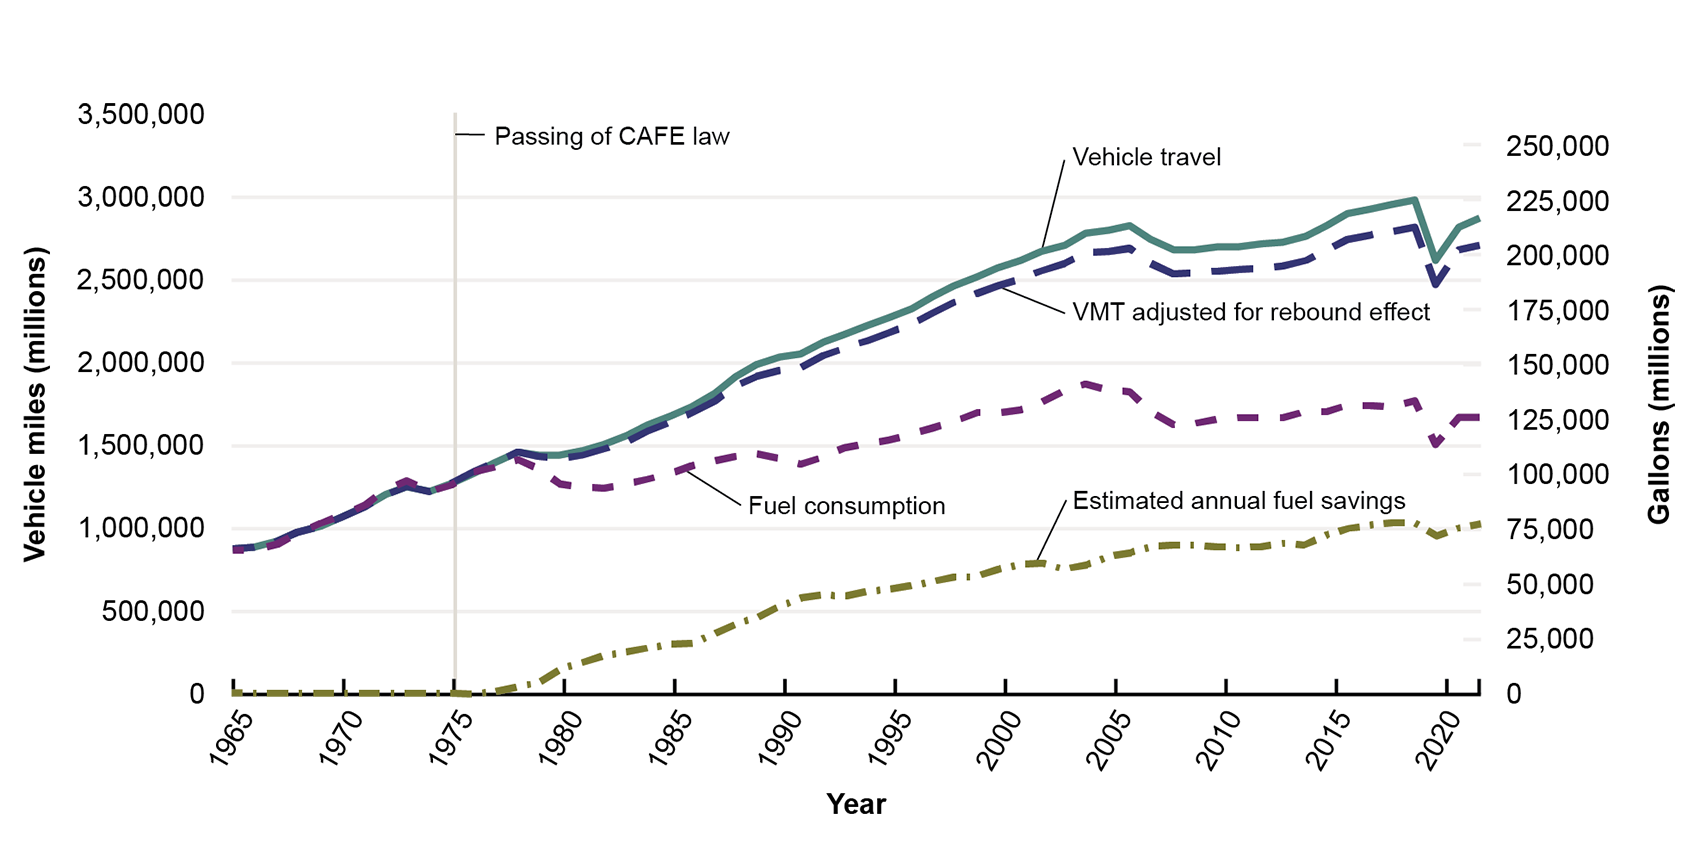
Miles of Travel and Fuel Use by Light-Duty Vehicles: 1965–2022

Key: VMT = Vehicle-Miles Traveled.

Figure

This line graph shows vehicle miles of travel, fuel consumption, and annual fuel savings before and after the passing of the CAFÉ law in 1975. The x-axis shows the year in 5-year intervals and the y-axis represents vehicle miles in millions and gallons of gasoline in millions. Fuel economy improvements to light-duty vehicles since the CAFE law was passed in 1975 are estimated to reduce fuel use, exceeding 2.2 trillion gallons of gasoline as of the end of 2022.

Dataset Excel:

F6-7 MPG Savings w Rebound Model.xlsx (6.09 MB)

Description:

This bar chart is from the 2024 Transportation Statistics Annual Report.

Source:

Greene et al., 2020, Updated spreadsheet provided by authors, 10/25/2024. VMT and fuel consumption data from U.S. Department of Transportaton, Federal Highway Administration, Highway Statistics, annual issues, Table VM-1.Note: VMT Adjusted for Rebound Effect shows how much lower VMT would have been without fuel economy improvments. Corporate Average Fuel Economy (CAFE) law was passed by Congress in 1975 as part of the Energy Policy and Conservation Act.

Publications: