
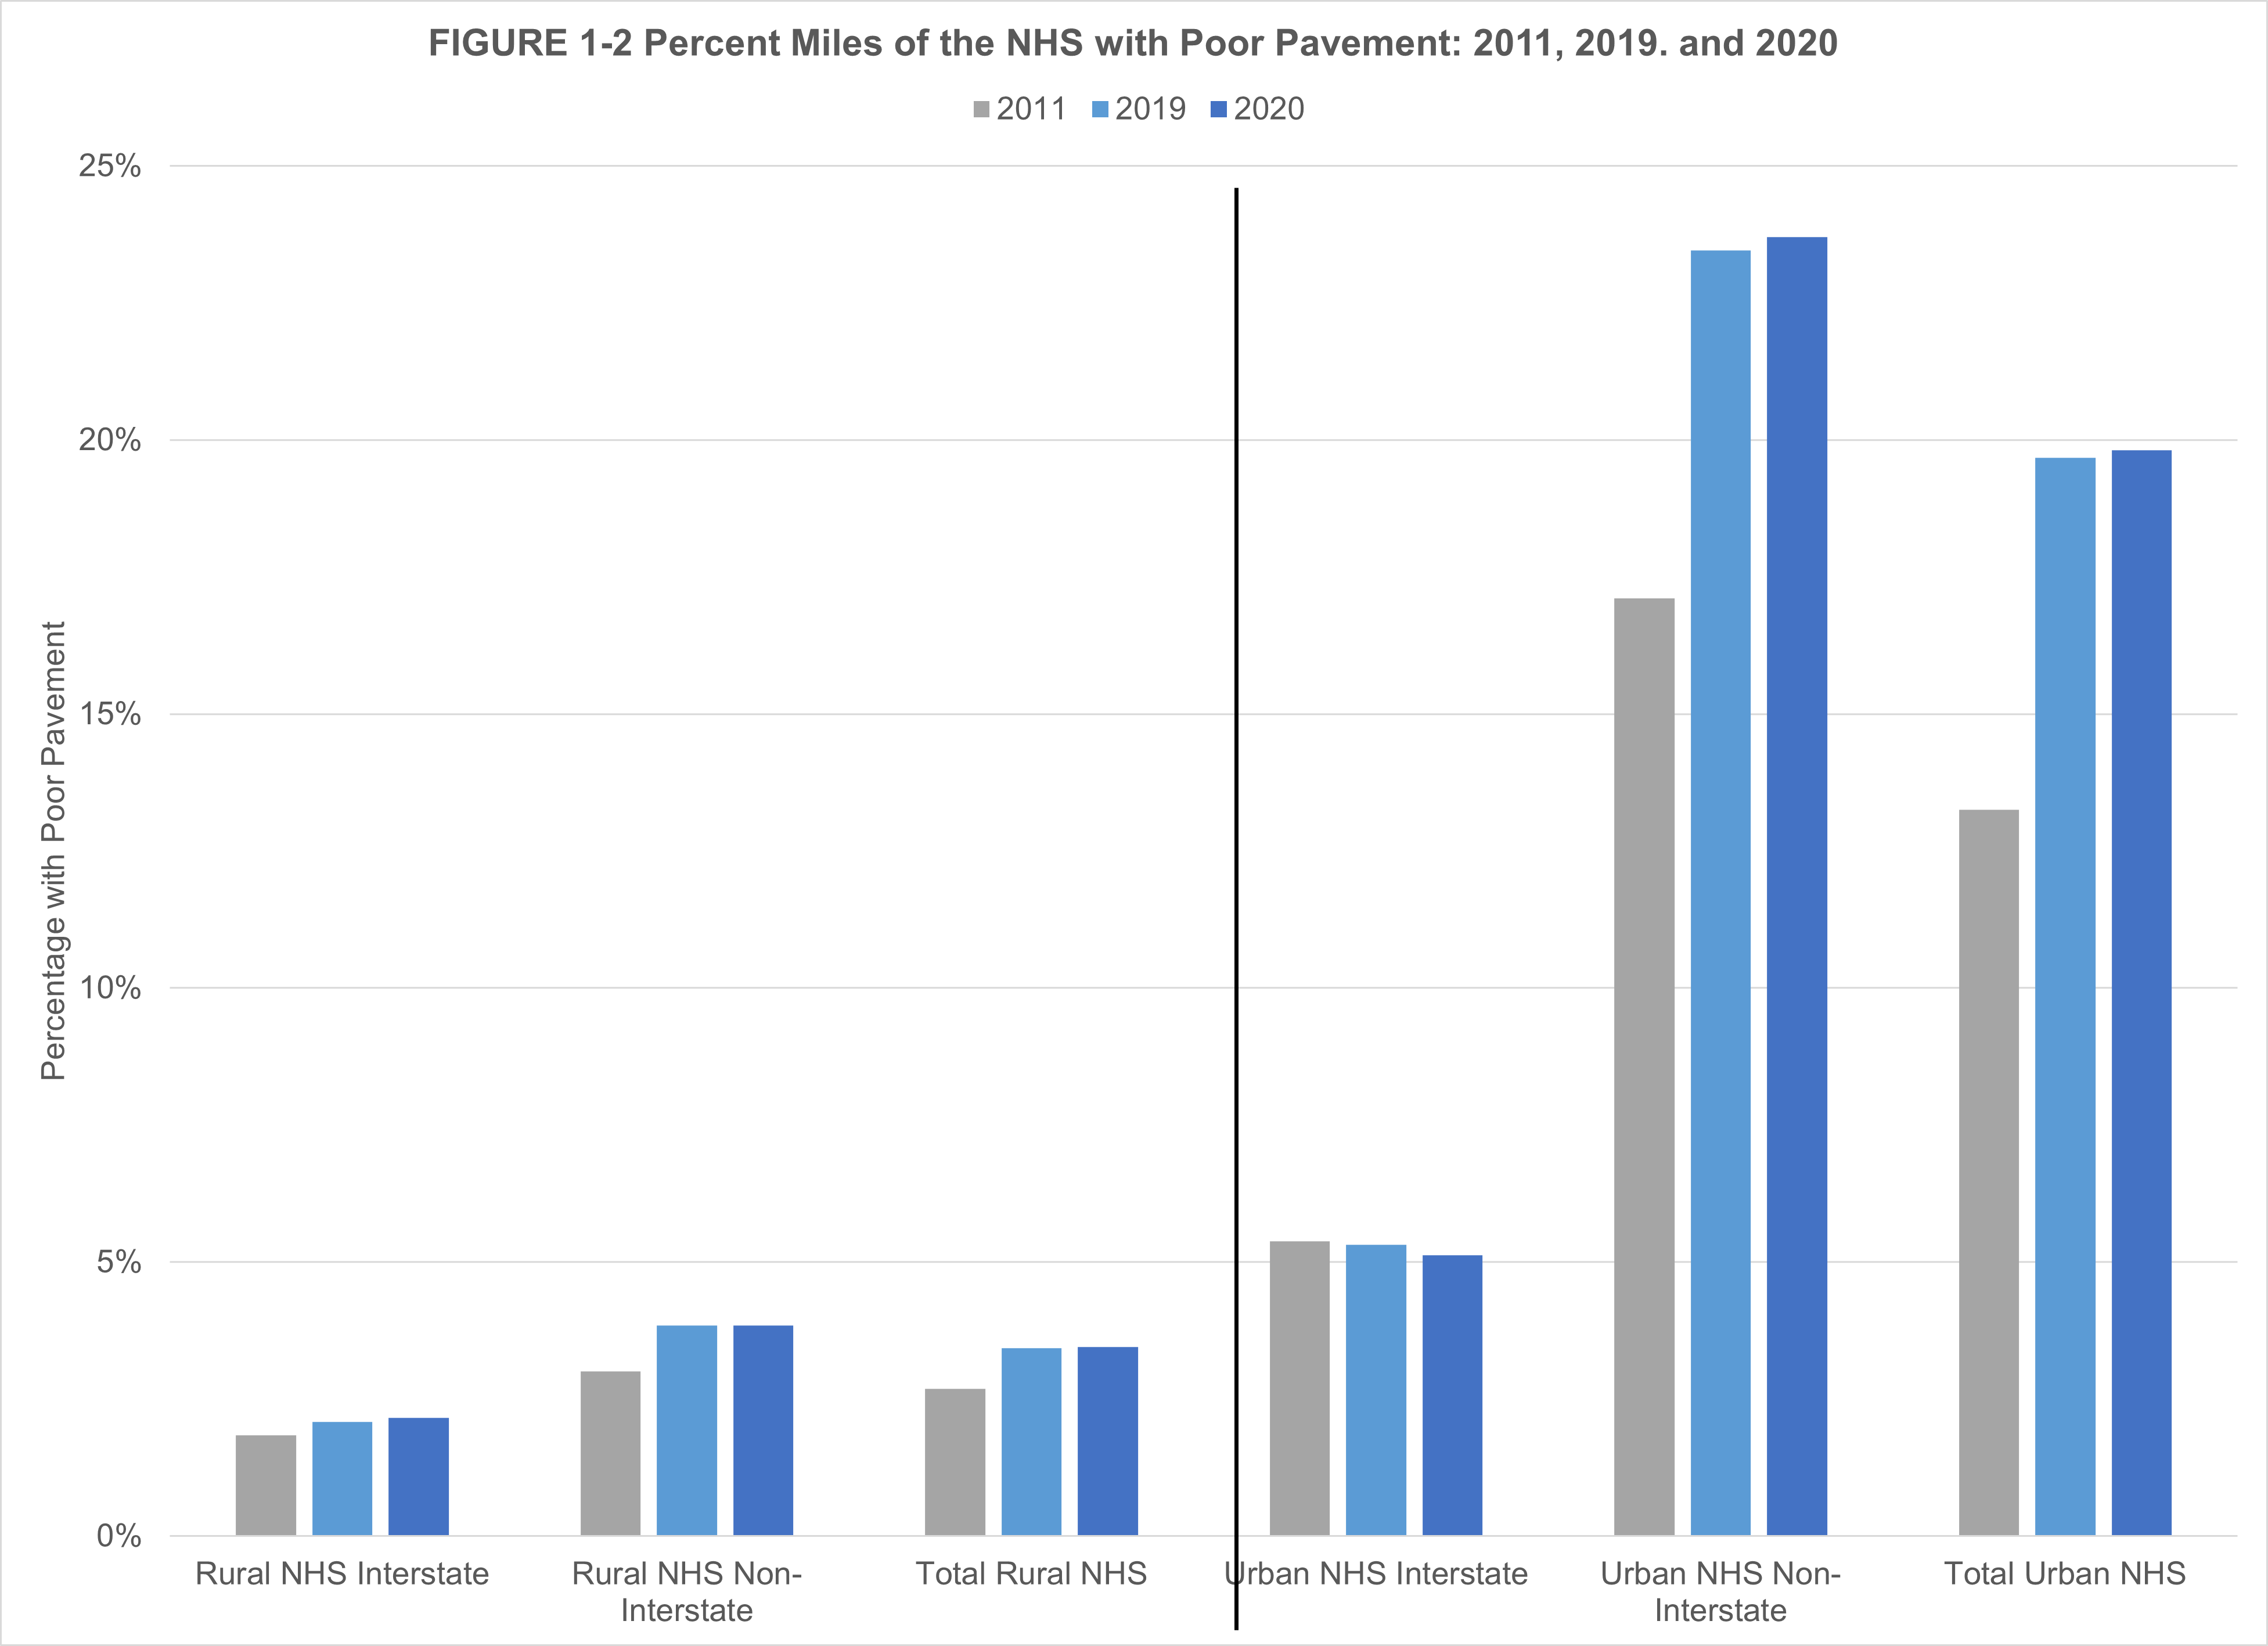
Percent Miles of the NHS System with Poor Pavement: 2011 and 2017-2020
Figure
Dataset Table:
| Road Classification |
|---|
Dataset Excel:
F1-2 Percent Miles of the NHS System with Poor Pavement 2011 2019 2020.xlsx (136.92 KB)Notes:
In the above figure, the total rural and urban NHS categories are a summary of the statistics of both the NHS interstate highways and non-interstate highways in each category including Puerto Rico. No data were reported for 2010 due to a change in the data model, so the data reported for 2011 were used. Poor condition is defined as any pavement with an IRI value greater than 170 inches/mile.
Description:
This bar chart is from the 2023 Transportation Statistics Annual Report.
Source:
U.S. Department of Transportation, Federal Highway Administration, Highway Statistics, Table HM-47, available at www.fhwa.dot.gov/policyinformation/statistics.cfm as of September 2023.
Related Datasets: