USA Banner

Official US Government Icon

Official websites use .gov
A .gov website belongs to an official government organization in the United States.

Secure Site Icon

Secure .gov websites use HTTPS
A lock ( ) or https:// means you’ve safely connected to the .gov website. Share sensitive information only on official, secure websites.

U.S. Department of Transportation U.S. Department of Transportation Icon United States Department of Transportation United States Department of Transportation

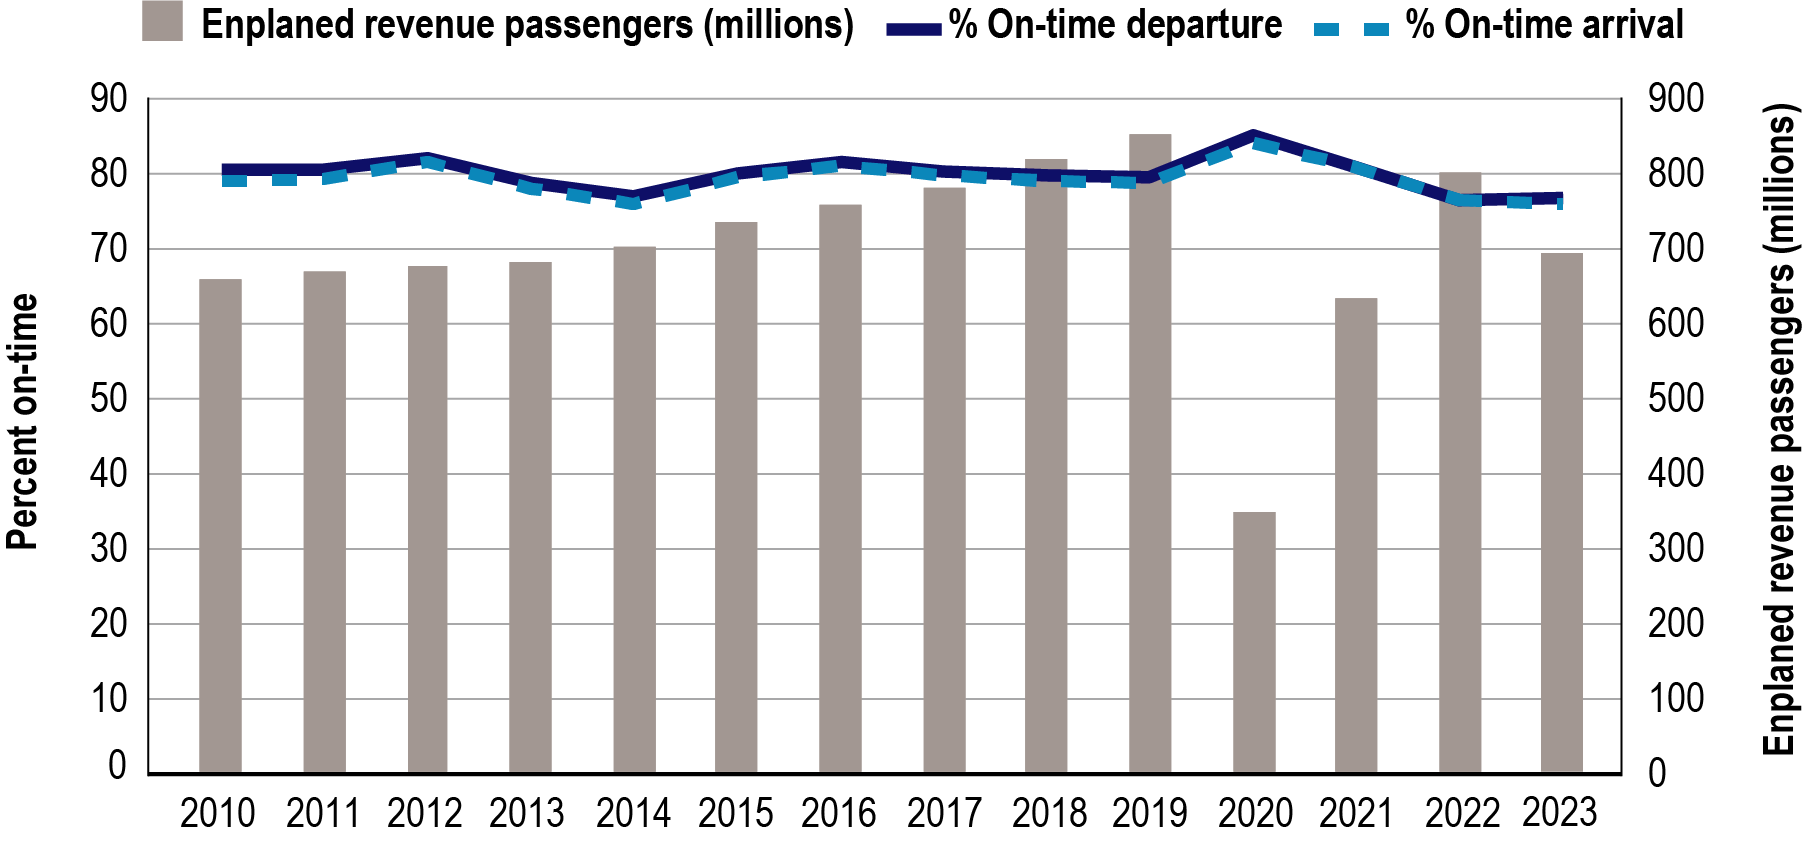
Percent On-Time Flight Departures and Arrivals 2010-2023

Figure

A combination line graph and bar chart showing the percentage of on-time flight departures and arrivals by enplaned revenue passengers from 2010 to 2023. The year with the highest number of enplaned revenue passengers was 2019, with nearly 860 million passengers. The least passengers were in 2020, with 350 million enplaned revenue passengers. The highest percentage of on-time departures occurred in 2003 and 2020, both at 86 percent. The highest percentage of on-time arrivals was in 2020 at 85 percent.

Notes:

2023 data is through September. A flight is considered delayed when it arrived 15 or more minutes later than the scheduled arrival or departed 15 or more minutes later than the scheduled departure. 

Source:

U.S. Department of Transportation, Bureau of Transportation Statistics, On-Time Percent Arrivals and Departures and T-100 Market Data, available at www.transtats.bts.gov as of December 2023.                                                                        
 

Publications: