USA Banner

Official US Government Icon

Official websites use .gov
A .gov website belongs to an official government organization in the United States.

Secure Site Icon

Secure .gov websites use HTTPS
A lock ( ) or https:// means you’ve safely connected to the .gov website. Share sensitive information only on official, secure websites.

U.S. Department of Transportation U.S. Department of Transportation Icon United States Department of Transportation United States Department of Transportation

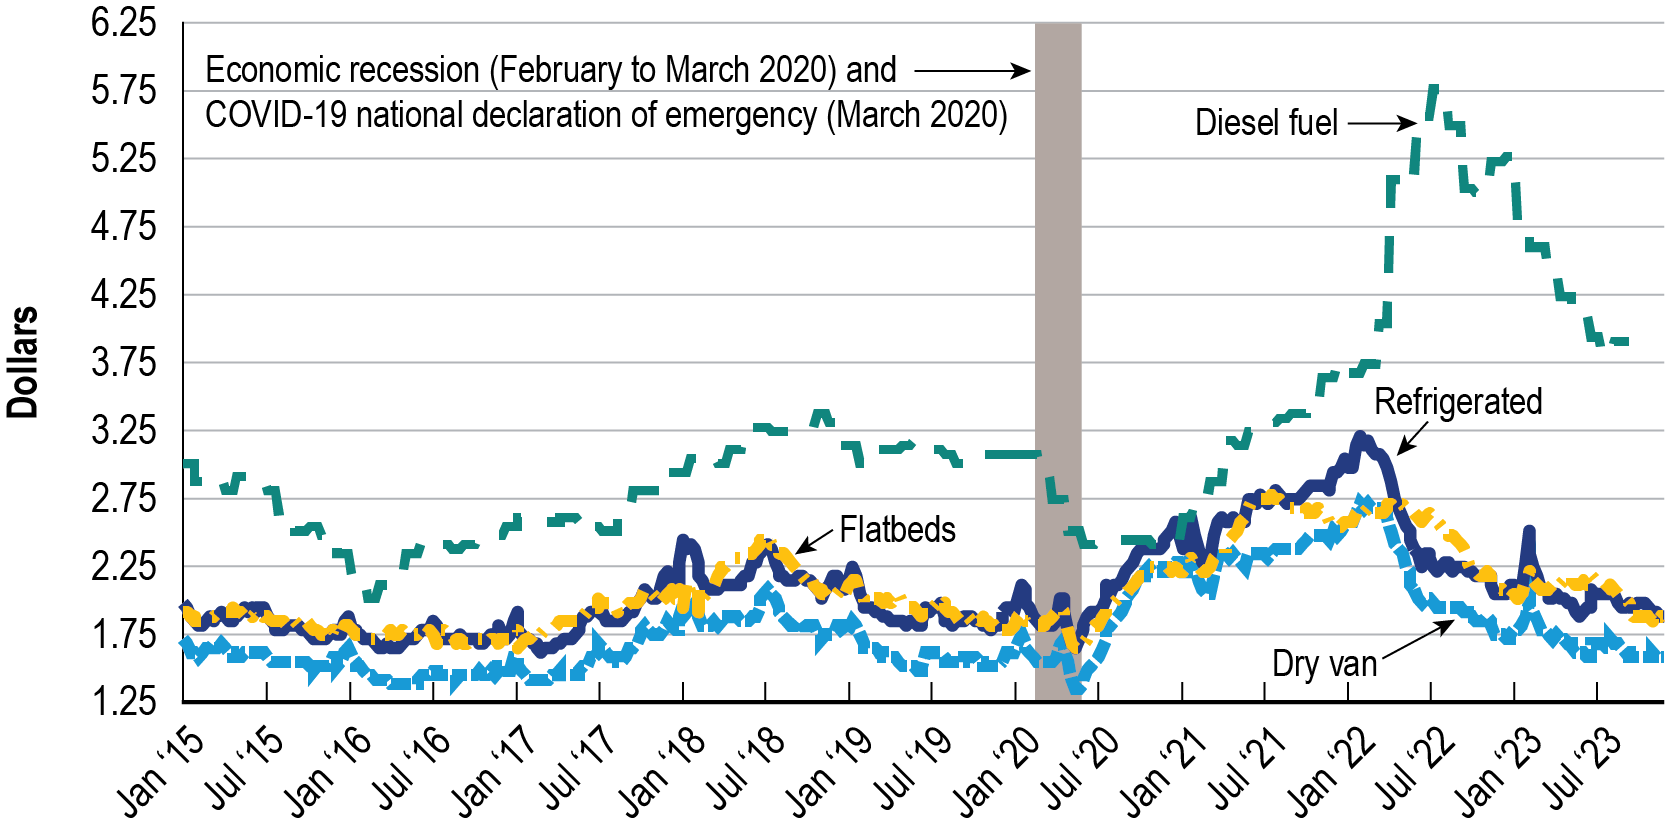
Truck Spot Rates Jan 2015-Oct 2023

Figure

Time series line graph showing the dollars per ton of downbound grain barges on the Mississippi River System and its tributaries from January 2013 to October 2023. There are seven series depicting the weekly barge rates originating from seven locations along the Mississippi River System and its tributaries: Cairo-Memphis, St. Louis, Lower Illinois, Twin Cities, Mid-Mississippi, Cincinnati, and Lower Ohio. All series show similar trends across the entire time frame with notable spikes occurring in October fo

Notes:

This data is for spot market trucking loads, which is approximately one-tenth of the overall common carrier trucking market. The data provider (DAT) is the largest clearinghouse for shipments that are not part of a pre-existing hauling contract. Dry van includes freight transported in enclosed cargo holds.                                
 

Source:

DAT Freight Analytics as of May 2024
 

Publications: