
2011 Surface Trade with Canada and Mexico Rose 14.3 Percent from 2010
(State Rankings in Tables 5 and 7)
Figure 1: Surface Trade between U.S. and NAFTA: 1995 2011
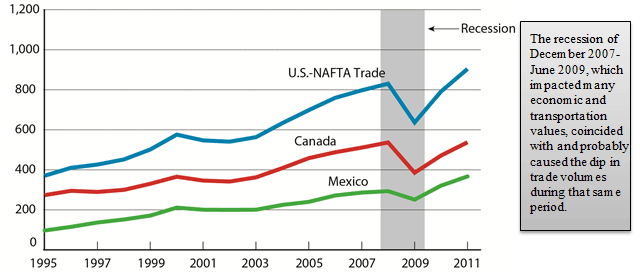
Wednesday, March 21, 2012 - Surface transportation trade between the United States and its North American Free Trade Agreement (NAFTA) partners Canada and Mexico increased by 14.3 percent in 2011 compared to 2010, valued at $904 billion in 2011, according to the Bureau of Transportation Statistics (BTS) of the U.S. Department of Transportation. The 14.3 percent increase in trade was the third largest year-to-year increase for the years covered by these data. The $904 billion in U.S.-NAFTA trade was the highest amount since NAFTA went into effect in 1994 (Table 1).
BTS, a part of the Research and Innovative Technology Administration (RITA), reported that total North American surface transportation imports increased by 13.8 percent in 2011 from 2010, and exports increased by 14.8 percent during the same period (Table 2).
U.S. land trade with Mexico declined less following the recession of 2008-2009 than did trade with Canada and it rebounded faster. U.S.-Mexico land trade declined 14.4 percent in 2009 from 2008, then increased by 46.3 percent in the next two years to reach a level in 2011 that was 25.3 percent higher than in 2008. U.S.-Canada land trade declined 28.1 percent in 2009 from 2008, then increased by 39.2 percent in the next two years to reach a level in 2011 that was virtually unchanged from 2008. As a result, U.S.-Mexico trade comprised 40.6 percent of North American surface freight in 2011, compared to 35.3 percent in 2008.
Figure 2: North American Surface Freight by Mode, 2011
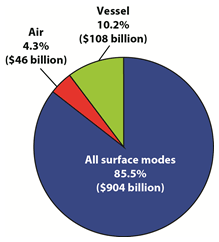
In 2011, 85.5 percent of U.S. merchandise trade by value with Canada and Mexico moved on land (Figure 2). Total North American surface transportation trade is up by 42.0 percent since 2009, when U.S.-NAFTA trade fell to a recent low during the last recession (Table 3). In 2009, U.S.-NAFTA trade dropped by 23.3 percent from the previous year. See North American Transborder Freight Data for historic data.
U.S. SURFACE TRANSPORTATION TRADE WITH CANADA
U.S. - Canada surface transportation trade totaled $537.0 billion in 2011, an increase of 14.0 percent compared to 2010 (Table 4). The value of imports carried by truck was 10.0 percent higher in 2011 than 2010 while the value of exports carried by truck was 12.4 percent higher. The value of pipeline exports increased the most, rising 87.0 percent in 2011 compared to 2010. Part of this increase is explained by a rise in the price of oil, with the average annual price for a barrel of crude oil increasing from $71.21 in 2010 to $87.04 in 2011 (Historical Crude Prices, Inflation Data.com(link is external)).
Michigan led all states in surface trade with Canada in 2011 with $68.4 billion (Table 5). Automotive vehicles accounted for $41.3 billion, 60.3 percent of total Michigan Canada surface trade. Of the top 10 states for U.S.-Canada surface trade in 2011, Minnesota had the highest percentage change over 2010, a 41.6 percent increase. Oil and gas is the top commodity traded between Minnesota and Canada but 16 of 99 commodities more than doubled in the value of Minnesota Canada surface trade between 2011 and 2010.
The top commodity category transported between the U.S. and Canada by surface modes of transportation in 2011 was vehicles and vehicle parts (other than railway vehicles and parts) with $96.1 billion in trade (Table 8). This U.S.-Canada trade in vehicle and vehicle parts was roughly split evenly between exports and imports, reflecting the interdependency of automotive plants on both sides of the border.
U.S. SURFACE TRANSPORTATION TRADE WITH MEXICO
U.S.Mexico surface transportation trade totaled $367.1 billion in 2011, an increase of 14.6 percent compared to 2010 (Table 6). The value of imports carried by truck was 12.4 percent higher in 2011 than 2010, while the value of exports carried by truck was 14.9 percent higher. As on the U.S.-Canada border, the value of pipeline exports had the highest year-over-year percentage increase along the U.S.-Mexico border, 71.3 percent.
Texas led all states in surface trade with Mexico in 2011 with $129.0 billion (Table 7). This is the third time on record that Texas has had more than $100 billion in trade with Mexico by surface modes of transportation in a calendar year. Three commodities more than doubled in the value of Texas Mexico trade in 2011 over 2010; they were: Railway Vehicles and Equipment, Cereals and Fur (despite the large percentage increase, a low total value of fur still crossed the U.S.-Mexico border, $251,707 in 2011). The top 10 states in 2011 U.S. Mexico surface trade all saw year-over-year increases of 12.1 to 20.4 percent.
The top commodity transported between the U.S. and Mexico by surface modes of transportation in 2011 was electrical machinery with $80.5 billion in trade (Table 9). Measuring and testing equipment was the fifth highest value commodity on the U.S. Mexico Border, compared with ranking as the 13th highest value commodity on the U.S. Canada Border.
TRANSBORDER DATA
The TransBorder Freight Dataset is a special extract of the official U.S. foreign trade statistics. The data are obtained by BTS from the U.S. Census Bureaus Foreign Trade Division. TransBorder numbers include data received by BTS as of Feb. 10.
The news release and summary tables can be found at www.bts.gov. More information on Transborder freight data is posted on the BTS website athttps://data.bts.gov/stories/s/TransBorder-Freight-Data/myhq-rm6q/.
TABLE 1. ANNUAL VALUE OF U.S. SURFACE TRANSPORTATION TRADE WITH CANADA AND MEXICO FROM PREVIOUS YEAR
(millions of dollars)
| Year | Amount | Percent Change from Previous Year |
|---|---|---|
| 1995 | 370,265 | NA |
| 1996 | 410,382 | 10.8 |
| 1997 | 425,977 | 3.8 |
| 1998 | 451,736 | 6.0 |
| 1999 | 501,250 | 11.0 |
| 2000 | 575,713 | 14.9 |
| 2001 | 547,312 | -4.9 |
| 2002 | 540,795 | -1.2 |
| 2003 | 562,776 | 4.1 |
| 2004 | 633,563 | 12.6 |
| 2005 | 697,987 | 10.2 |
| 2006 | 760,127 | 8.9 |
| 2007 | 797,303 | 4.9 |
| 2008 | 829,875 | 4.1 |
| 2009 | 636,695 | -23.3 |
| 2010 | 791,329 | 24.3 |
| 2011 | 904,133 | 14.3 |
SOURCE: U.S. Department of Transportation, Research and Innovative Technology Administration, Bureau of Transportation Statistics, based on Transborder Freight Data, available athttps://data.bts.gov/stories/s/TransBorder-Freight-Data/myhq-rm6q/, as of February 16, 2012.
NOTES: Numbers may not add to totals due to rounding. Percent Changes based on numbers prior to rounding. NA = Not Available
TABLE 2. U.S. MERCHANDISE TRADE WITH CANADA AND MEXICO BY SURFACE MODES OF TRANSPORTATION
(millions of dollars)
| Mode | 2009 | 2010 | 2011 | Percent Change 2009 - 2010 | Percent Change 2010 - 2011 | |
|---|---|---|---|---|---|---|
| All Surface Modes | Imports | 341,665 | 427,592 | 486,662 | 25.1 | 13.8 |
| Exports | 295,031 | 363,738 | 417,471 | 23.3 | 14.8 | |
| Total | 636,695 | 791,329 | 904,133 | 24.3 | 14.3 | |
| Truck | Imports | 222,866 | 272,186 | 303,012 | 22.1 | 11.3 |
| Exports | 231,961 | 284,698 | 322,846 | 22.7 | 13.4 | |
| Rail | Imports | 60,361 | 85,480 | 97,422 | 41.6 | 14.0 |
| Exports | 35,263 | 45,748 | 54,431 | 29.7 | 19.0 | |
| Pipeline | Imports | 45,786 | 57,744 | 71,024 | 26.1 | 23.0 |
| Exports | 3,420 | 5,189 | 9,703 | 51.7 | 87.0 |
SOURCE: U.S. Department of Transportation, Research and Innovative Technology Administration, Bureau of Transportation Statistics, based on Transborder Freight Data, available athttps://data.bts.gov/stories/s/TransBorder-Freight-Data/myhq-rm6q/, as of February 29, 2012.
NOTE: Numbers may not add to totals due to rounding. Percent Changes based on numbers prior to rounding. The value of trade for all surface modes is not equal to the sum of truck, rail and pipeline modes. It also includes shipments made by mail, foreign trade zones, other and unknown modes of transportation. For additional detail refer to the Transborder web page: https://data.bts.gov/stories/s/TransBorder-Freight-Data/myhq-rm6q/.
TABLE 3. PRIOR YEAR SURFACE TRADE WITH CANADA AND MEXICO COMPARED WITH 2011
| 2011 Compared to | Percent Change to 2011 | ||
|---|---|---|---|
| Imports | Exports | Total Surface Trade | |
| 2010 | 13.8 | 14.8 | 14.3 |
| 2009 | 42.4 | 41.5 | 42.0 |
| 2008 | 4.7 | 14.3 | 8.9 |
| 2007 | 7.6 | 21.1 | 13.4 |
| 2006 | 12.1 | 28.0 | 18.9 |
| 2005 | 21.4 | 40.5 | 29.5 |
| 2004 | 33.6 | 55.1 | 42.7 |
| 2003 | 51.0 | 73.6 | 60.7 |
| 2002 | 57.4 | 80.3 | 67.2 |
| 2001 | 55.6 | 78.0 | 65.2 |
SOURCE: U.S. Department of Transportation, Research and Innovative Technology Administration, Bureau of Transportation Statistics, based on Transborder Freight Data, available athttps://data.bts.gov/stories/s/TransBorder-Freight-Data/myhq-rm6q/, as of February 29, 2012.
TABLE 4. U.S. MERCHANDISE TRADE WITH CANADA BY SURFACE MODES OF TRANSPORTATION
(millions of dollars)
| Mode | 2009 | 2010 | 2011 | Percent Change 2009 - 2010 | Percent Change 2010 - 2011 | |
|---|---|---|---|---|---|---|
| All Surface Modes | Imports | 201,089 | 246,252 | 282,582 | 22.5 | 14.8 |
| Exports | 184,653 | 224,809 | 254,450 | 21.7 | 13.2 | |
| Total | 385,742 | 471,061 | 537,031 | 22.1 | 14.0 | |
| Truck | Imports | 105,079 | 123,238 | 135,528 | 17.3 | 10.0 |
| Exports | 142,545 | 173,588 | 195,126 | 21.8 | 12.4 | |
| Rail | Imports | 41,058 | 56,996 | 65,118 | 38.8 | 14.3 |
| Exports | 19,973 | 26,116 | 29,569 | 30.8 | 13.2 | |
| Pipeline | Imports | 45,630 | 57,562 | 70,743 | 26.1 | 22.9 |
| Exports | 2,632 | 3,151 | 6,211 | 19.7 | 97.1 |
SOURCE: U.S. Department of Transportation, Research and Innovative Technology Administration, Bureau of Transportation Statistics, based on Transborder Freight Data, available athttps://data.bts.gov/stories/s/TransBorder-Freight-Data/myhq-rm6q/, as of February 29, 2012.
NOTE: Numbers may not add to totals due to rounding. Percent Changes based on numbers prior to rounding. The value of trade for all surface modes is not equal to the sum of truck, rail and pipeline modes. It also includes shipments made by mail, foreign trade zones, other and unknown modes of transportation. For additional detail refer to the Transborder web page: https://data.bts.gov/stories/s/TransBorder-Freight-Data/myhq-rm6q/.
TABLE 5. TOP 10 STATES TRADING WITH CANADA BY ALL SURFACE MODES OF TRANSPORTATION
Ranked by 2011 Surface Trade Value
(millions of dollars)
| State | 2010 | 2011 | Percent Change 2010 - 2011 | ||
|---|---|---|---|---|---|
| Value | Rank | Value | Rank | ||
| Michigan | 60,683 | 1 | 68,412 | 1 | 12.7 |
| Illinois | 43,136 | 2 | 53,845 | 2 | 24.8 |
| Ohio | 29,825 | 4 | 33,123 | 3 | 11.1 |
| California | 31,509 | 3 | 31,331 | 4 | -0.6 |
| Texas | 25,920 | 6 | 30,608 | 5 | 18.1 |
| New York | 28,998 | 5 | 30,076 | 6 | 3.7 |
| Pennsylvania | 18,850 | 7 | 21,097 | 7 | 11.9 |
| Washington | 18,615 | 8 | 20,250 | 8 | 8.8 |
| Minnesota | 12,848 | 10 | 18,193 | 9 | 41.6 |
| Indiana | 16,025 | 9 | 17,714 | 10 | 10.5 |
SOURCE: U.S. Department of Transportation, Research and Innovative Technology Administration, Bureau of Transportation Statistics, based on Transborder Freight Data, available athttps://data.bts.gov/stories/s/TransBorder-Freight-Data/myhq-rm6q/, as of February 29, 2012.
NOTE: Percent Change based on numbers prior to rounding.
TABLE 6. U.S. MERCHANDISE TRADE WITH MEXICO BY SURFACE MODES OF TRANSPORTATION
(millions of dollars)
| Mode | 2009 | 2010 | 2011 | Percent Change 2009 - 2010 | Percent Change 2010 - 2011 | |
|---|---|---|---|---|---|---|
| All Surface Modes | Imports | 140,576 | 181,339 | 204,080 | 29.0 | 12.5 |
| Exports | 110,378 | 138,929 | 163,021 | 25.9 | 17.3 | |
| Total | 250,954 | 320,268 | 367,101 | 27.6 | 14.6 | |
| Truck | Imports | 117,787 | 148,948 | 167,483 | 26.5 | 12.4 |
| Exports | 89,417 | 111,110 | 127,720 | 24.3 | 14.9 | |
| Rail | Imports | 19,303 | 28,484 | 32,303 | 47.6 | 13.4 |
| Exports | 15,291 | 19,632 | 24,862 | 28.4 | 26.6 | |
| Pipeline | Imports | 155 | 182 | 281 | 16.9 | 54.9 |
| Exports | 788 | 2,038 | 3,492 | 158.7 | 71.3 |
SOURCE: U.S. Department of Transportation, Research and Innovative Technology Administration, Bureau of Transportation Statistics, based on Transborder Freight Data, available athttps://data.bts.gov/stories/s/TransBorder-Freight-Data/myhq-rm6q/, as of February 29, 2012.
NOTE: Numbers may not add to totals due to rounding. Percent Changes based on numbers prior to rounding. The value of trade for all surface modes is not equal to the sum of truck, rail and pipeline modes. It also includes shipments made by mail, foreign trade zones, other and unknown modes of transportation. For additional detail refer to the Transborder web page: https://data.bts.gov/stories/s/TransBorder-Freight-Data/myhq-rm6q/.
TABLE 7. TOP 10 STATES TRADING WITH MEXICO BY ALL SURFACE MODES OF TRANSPORTATION
Ranked by 2011 Surface Trade Value
(millions of dollars)
| State | 2010 | 2011 | Percent Change 2010 - 2011 | ||
|---|---|---|---|---|---|
| Value | Rank | Value | Rank | ||
| Texas | &114,502 | 1 | &128,981 | 1 | 12.7 |
| California | 47,606 | 2 | 47,606 | 2 | 14.5 |
| Michigan | 35,106 | 3 | 41,376 | 3 | 17.9 |
| Illinois | 10,748 | 4 | 12,588 | 4 | 17.1 |
| Arizona | 10,456 | 5 | 11,725 | 5 | 12.1 |
| Ohio | 8,505 | 6 | 9,687 | 6 | 13.9 |
| Tennessee | 6,379 | 7 | 7,326 | 7 | 12.9 |
| Indiana | 5,509 | 8 | 6,633 | 8 | 20.4 |
| North Carolina | 5,156 | 9 | 6,009 | 9 | 16.6 |
| Georgia | 4,663 | 12 | 5,265 | 10 | 12.9 |
SOURCE: U.S. Department of Transportation, Research and Innovative Technology Administration, Bureau of Transportation Statistics, based on Transborder Freight Data, available athttps://data.bts.gov/stories/s/TransBorder-Freight-Data/myhq-rm6q//, as of February 29, 2012.
NOTE: Percent Change based on numbers prior to rounding.
TABLE 8. TOP FIVE COMMODITIES TRANSPORTED BETWEEN THE U.S. AND CANADA BY ALL SURFACE MODES OF TRANSPORTATION, 2011
(millions of dollars)
| Commodities | Exports | Imports | Total |
|---|---|---|---|
| Vehicles Other than Railway | 46,455 | 49,689 | 96,144 |
| Mineral Fuels; Oils and Waxes | 12,298 | 82,718 | 95,016 |
| Computer-Related Machinery and Parts | 41,319 | 17,987 | 59,306 |
| Electrical Machinery; Equipment and Parts | 22,358 | 6,321 | 28,679 |
| Plastics | 12,341 | 10,279 | 22,619 |
SOURCE: U.S. Department of Transportation, Research and Innovative Technology Administration, Bureau of Transportation Statistics, based on Transborder Freight Data, available athttps://data.bts.gov/stories/s/TransBorder-Freight-Data/myhq-rm6q/, as of March 13, 2012.
NOTE: Numbers may not add to totals due to rounding.
TABLE 9. TOP FIVE COMMODITIES TRANSPORTED BETWEEN THE U.S. AND MEXICO BY ALL SURFACE MODES OF TRANSPORTATION, 2011
(millions of dollars)
| Commodities | Exports | Imports | Total |
|---|---|---|---|
| Electrical Machinery; Equipment and Parts | 29,672 | 50,799 | 80,471 |
| Computer-Related Machinery and Parts | 29,703 | 37,864 | 67,567 |
| Vehicles Other than Railway | 17,726 | 43,446 | 61,172 |
| Plastics | 12,570 | 3,369 | 15,939 |
| Measuring and Testing Equipment | 4,083 | 9,348 | 13,431 |
SOURCE: U.S. Department of Transportation, Research and Innovative Technology Administration, Bureau of Transportation Statistics, based on Transborder Freight Data, available athttps://data.bts.gov/stories/s/TransBorder-Freight-Data/myhq-rm6q/, as of March 13, 2012.
NOTE: Numbers may not add to totals due to rounding.