
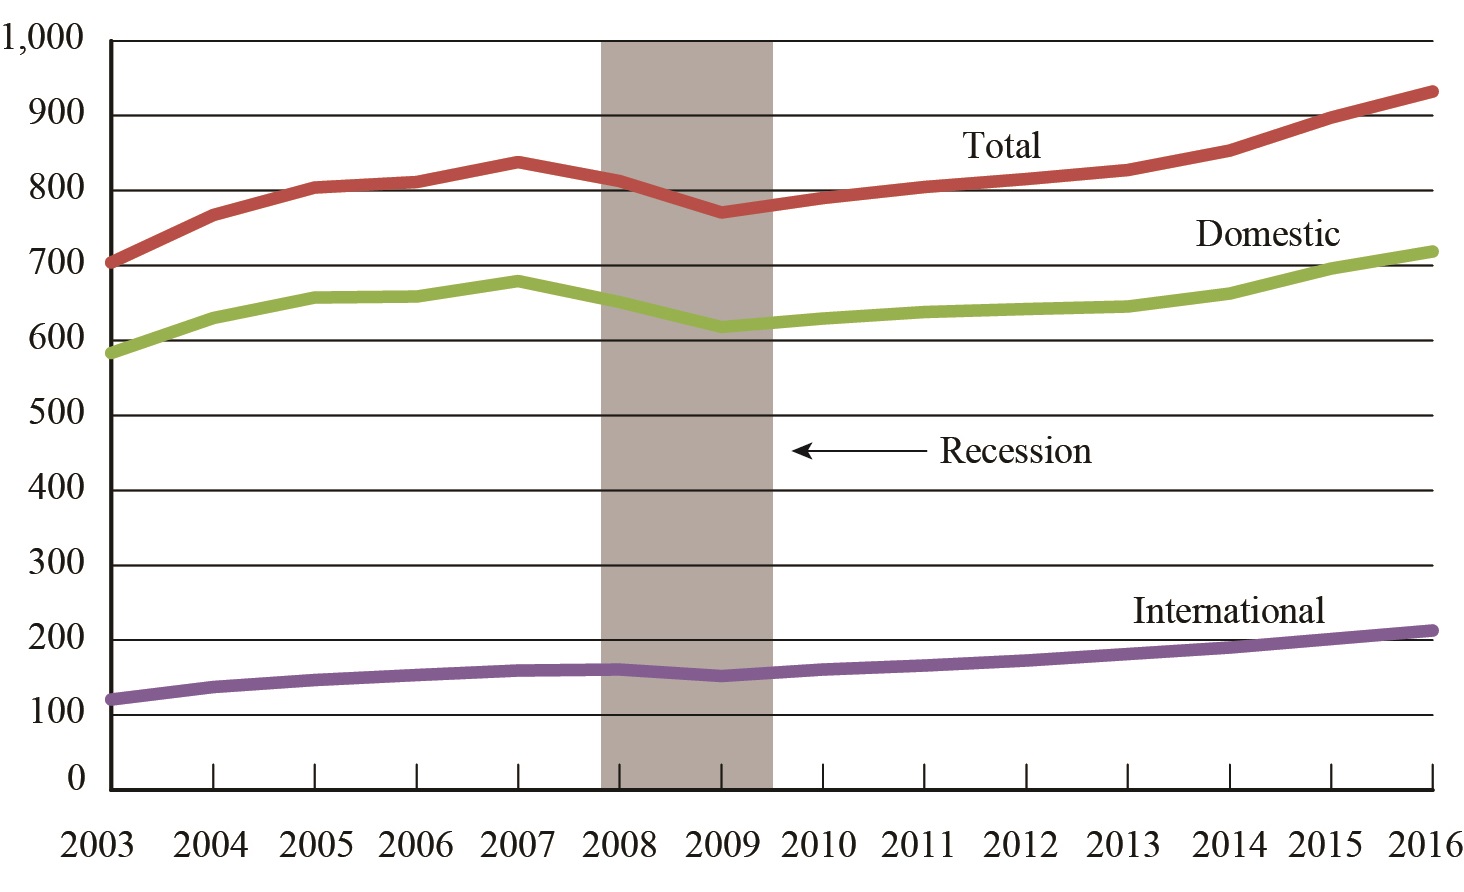
Annual Passengers on All U.S. Scheduled Airline Flights (Domestic & International) and Foreign Airline Flights to and from the United States, 2003-2006
Passengers (000,000)
Figure
Dataset Table:
| Year | Total | Domestic | International |
|---|---|---|---|
| 2003 | 704.1 | 583.3 | 120.8 |
| 2004 | 767.2 | 629.8 | 137.4 |
| 2005 | 804.4 | 657.3 | 147.1 |
| 2006 | 811.7 | 658.4 | 153.4 |
| 2007 | 838.5 | 679.2 | 159.3 |
| 2008 | 812.7 | 651.7 | 161.0 |
| 2009 | 770.6 | 618.1 | 152.5 |
| 2010 | 790.2 | 629.5 | 160.7 |
| 2011 | 804.6 | 638.2 | 166.3 |
| 2012 | 815.5 | 642.3 | 173.2 |
| 2013 | 827.3 | 645.7 | 181.6 |
| 2014 | 853.3 | 662.8 | 190.5 |
| 2015 | 897.9 | 696.0 | 201.9 |
| 2016 | 932.0 | 719.0 | 213.0 |
Source:
Bureau of Transportation Statistics, T-100 Market (All Carriers)