
December 2011 Surface Trade with Canada and Mexico Rose 11.6 Percent from December 2010
North American Surface Trade, January 2010 - December 2011
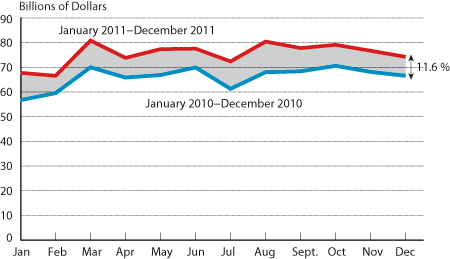
Tuesday, February 28, 2012 - Trade using surface transportation between the United States and its North American neighbors, Canada and Mexico, was 11.6 percent higher in December 2011 than in December 2010, totaling $74.2 billion (Table 1), according to the Bureau of Transportation Statistics (BTS) of the U.S. Department of Transportation.
BTS, a part of the Research and Innovative Technology Administration, reported that the December 2011 value of U.S. surface transportation trade with Canada and Mexico, the United States North American Free Trade Agreement (NAFTA) partners, rose 27.0 percent in the past two years from December 2009, and 40.3 percent from December 2008 (Table 3).
The value of U.S. surface transportation trade with Canada and Mexico in December increased by 25.7 percent when compared to December 2006, and also increased by 94.1 percent when compared to December 2001, a period of 10 years. Imports in December were up 85.7 percent since December 2001, while exports were up 105.2 percent (Table 3). See Transborder Press Releases for historic data. Values in this press release are not adjusted for inflation.
Surface transportation includes freight movements by truck, rail, pipeline, mail, Foreign Trade Zones, and other. In December, 85.5 percent of U.S. trade by value with Canada and Mexico moved via land, 10.0 percent moved by vessel, and 4.5 percent moved by air (Table 8).
The value of U.S. surface transportation trade with Canada and Mexico decreased 3.2 percent in December 2011 from November 2011 (Table 2). Month-to-month changes can be affected by seasonal variations and other factors.
U.S.-Canada and U.S.-Mexico surface transportation trade both increased compared to December 2010 with U.S.-Canada reaching $44.2 billion, an 11.2 percent increase, and U.S.-Mexico reaching $30.0 billion, a 12.1 percent increase. For trade numbers by mode, see Table 4 for Canada and Table 6 for Mexico.
In December trade by state, Michigan led all states in surface trade with Canada as it has in previous years, at $5.6 billion, a 19.7 percent increase from December 2010 (Table 5). Texas also continued to lead all states in surface trade with Mexico at $10.3 billion, an 8.7 percent increase from December 2010 (Table 7).
The news release and summary tables can be found at www.bts.gov. More information on TransBorder Freight Data, data from previous months, and individual state data are available online on the BTS website at https://data.bts.gov/stories/s/TransBorder-Freight-Data/myhq-rm6q//. BTS has scheduled release of January TransBorder numbers for March 27.
TABLE 1. VALUE OF MONTHLY U.S. SURFACE TRANSPORTATION TRADE WITH CANADA AND MEXICO
(millions of dollars)
| Month | 2009 | 2010 | 2011 | Percent Change 2009-2010 | Percent Change 2010-2011 |
|---|---|---|---|---|---|
| January | 47,459 | 56,697 | 67,734 | 19.5 | 19.5 |
| February | 47,938 | 59,492 | 66,534 | 24.1 | 11.8 |
| March | 51,055 | 69,943 | 80,822 | 37.0 | 15.6 |
| April | 49,729 | 65,831 | 73,767 | 32.4 | 12.1 |
| May | 47,881 | 66,805 | 77,318 | 39.5 | 15.7 |
| June | 50,753 | 69,859 | 77,521 | 37.6 | 11.0 |
| July | 51,545 | 61,260 | 72,363 | 18.8 | 18.1 |
| August | 54,254 | 67,964 | 80,406 | 25.3 | 18.3 |
| September | 57,294 | 68,324 | 77,725 | 19.3 | 13.8 |
| October | 61,400 | 70,565 | 79,040 | 14.9 | 12.0 |
| November | 58,922 | 68,060 | 76,672 | 15.5 | 12.7 |
| December | 58,465 | 66,530 | 74,230 | 13.8 | 11.6 |
| Annual | 636,695 | 791,329 | 904,133 | 24.3 | 14.3 |
SOURCE: BTS TransBorder Freight Data, https://data.bts.gov/stories/s/TransBorder-Freight-Data/myhq-rm6q/
NOTE: Numbers might not add to totals due to rounding. Percent changes based on numbers prior to rounding.
TABLE 2. U.S. SURFACE TRADE WITH CANADA AND MEXICO BY SURFACE MODES OF TRANSPORTATION
(millions of dollars)
| Mode | December 2010 | November 2011 | December 2011 | Percent Change November-December 2011 | Percent Change December 2010-2011 | |
|---|---|---|---|---|---|---|
| All Surface Modes | Imports | 36,345 | 41,251 | 40,469 | -1.9 | 11.3 |
| Exports | 30,185 | 35,421 | 33,761 | -4.7 | 11.8 | |
| Total | 66,530 | 76,672 | 74,230 | -3.2 | 11.6 | |
| Truck | Imports | 22,480 | 26,311 | 23,999 | -8.8 | 6.8 |
| Exports | 23,390 | 27,338 | 26,126 | -4.4 | 11.7 | |
| Rail | Imports | 7,106 | 8,134 | 8,689 | 6.8 | 22.3 |
| Exports | 3,785 | 4,838 | 4,463 | -7.7 | 17.9 | |
| Pipeline | Imports | 5,157 | 5,581 | 6,398 | 14.6 | 24.1 |
| Exports | 549 | 714 | 583 | -18.3 | 6.3 |
SOURCE: BTS TransBorder Freight Data, https://data.bts.gov/stories/s/TransBorder-Freight-Data/myhq-rm6q/
NOTES: Numbers might not add to totals due to rounding. Percent changes based on numbers prior to rounding. The value of trade for all surface modes is not equal to the sum of truck, rail and pipeline modes, it also includes shipments made by mail, foreign trade zones, and other transportation. For additional detail, please refer to the TransBorder web page:https://data.bts.gov/stories/s/TransBorder-Freight-Data/myhq-rm6q/
TABLE 3. DECEMBER 2011 SURFACE TRADE WITH CANADA AND MEXICO COMPARED WITH DECEMBER OF PRIOR YEARS
| Compared to December in... | Percent Change | ||
|---|---|---|---|
| Imports | Exports | Total Surface Trade | |
| 2010 | 11.3 | 11.8 | 11.6 |
| 2009 | 26.3 | 27.7 | 27.0 |
| 2008 | 40.0 | 40.7 | 40.3 |
| 2007 | 17.3 | 27.9 | 21.9 |
| 2006 | 19.3 | 34.3 | 25.7 |
| 2005 | 17.2 | 37.4 | 25.6 |
| 2004 | 36.4 | 50.7 | 42.6 |
| 2003 | 56.0 | 73.3 | 63.4 |
| 2002 | 71.5 | 96.4 | 82.0 |
| 2001 | 85.7 | 105.2 | 94.1 |
SOURCE: BTS TransBorder Freight Data, https://data.bts.gov/stories/s/TransBorder-Freight-Data/myhq-rm6q/
TABLE 4. U.S. MERCHANDISE TRADE WITH CANADA BY SURFACE MODES OF TRANSPORTATION
(millions of dollars)
| Mode | December 2010 | November 2011 | December 2011 | Percent Change November-December 2011 | Percent Change December 2010-2011 | |
|---|---|---|---|---|---|---|
| All Surface Modes | Imports | 21,432 | 23,336 | 23,819 | 2.1 | 11.1 |
| Exports | 18,330 | 20,952 | 20,404 | -2.6 | 11.3 | |
| Total | 39,762 | 44,289 | 44,223 | -0.1 | 11.2 | |
| Truck | Imports | 10,399 | 11,473 | 10,541 | -8.1 | 1.4 |
| Exports | 14,106 | 15,993 | 15,702 | -1.8 | 11.3 | |
| Rail | Imports | 4,707 | 5,445 | 5,805 | 6.6 | 23.3 |
| Exports | 2,095 | 2,556 | 2,355 | -7.9 | 12.4 | |
| Pipeline | Imports | 5,142 | 5,560 | 6,375 | 14.7 | 24.0 |
| Exports | 227 | 474 | 348 | -26.6 | 53.3 |
SOURCE: BTS TransBorder Freight Data, https://data.bts.gov/stories/s/TransBorder-Freight-Data/myhq-rm6q/
NOTES: Numbers might not add to totals due to rounding. Percent changes based on numbers prior to rounding. The value of trade for all surface modes is not equal to the sum of truck, rail and pipeline modes, it also includes shipments made by mail, foreign trade zones, and other transportation. For additional detail, please refer to the TransBorder web page:https://data.bts.gov/stories/s/TransBorder-Freight-Data/myhq-rm6q/
TABLE 5. TOP 10 STATES TRADING WITH CANADA BY ALL SURFACE MODES OF TRANSPORTATION
Ranked by December 2011 Surface Trade Value
(millions of dollars)
| State | December 2010 | December 2011 | Percent Change December 2010-2011 | ||
|---|---|---|---|---|---|
| Value | Rank | Value | Rank | ||
| Michigan | 4,672 | 1 | 5,592 | 1 | 19.7 |
| Illinois | 3,824 | 2 | 4,756 | 2 | 24.4 |
| California | 2,462 | 4 | 2,844 | 3 | 15.5 |
| Ohio | 2,394 | 5 | 2,626 | 4 | 9.7 |
| Texas | 2,300 | 6 | 2,518 | 5 | 9.5 |
| New York | 3,276 | 3 | 2,336 | 6 | -28.7 |
| Pennsylvania | 1,486 | 8 | 1,687 | 7 | 13.5 |
| Washington | 1,551 | 7 | 1,635 | 8 | 5.4 |
| Minnesota | 1,288 | 9 | 1,617 | 9 | 25.6 |
| Indiana | 1,202 | 10 | 1,425 | 10 | 18.5 |
SOURCE: BTS TransBorder Freight Data, https://data.bts.gov/stories/s/TransBorder-Freight-Data/myhq-rm6q/
NOTES: Numbers might not add to totals due to rounding. Percent changes based on numbers prior to rounding.
TABLE 6. U.S. MERCHANDISE TRADE WITH MEXICO BY SURFACE MODES OF TRANSPORTATION
(millions of dollars)
| Mode | December 2010 | November 2011 | December 2011 | Percent Change November-December 2011 | Percent Change December 2010-2011 | |
|---|---|---|---|---|---|---|
| All Surface Modes | Imports | 14,913 | 17,915 | 16,649 | -7.1 | 11.6 |
| Exports | 11,855 | 14,469 | 13,357 | -7.7 | 12.7 | |
| Total | 26,768 | 32,384 | 30,007 | -7.3 | 12.1 | |
| Truck | Imports | 12,081 | 14,839 | 13,458 | -9.3 | 11.4 |
| Exports | 9,284 | 11,344 | 10,424 | -8.1 | 12.3 | |
| Rail | Imports | 2,399 | 2,689 | 2,884 | 7.3 | 20.2 |
| Exports | 1,690 | 2,281 | 2,108 | -7.6 | 24.7 | |
| Pipeline | Imports | 15 | 21 | 22 | 7.7 | 45.1 |
| Exports | 322 | 240 | 236 | -1.9 | -26.8 |
NOTES: Numbers might not add to totals due to rounding. Percent changes based on numbers prior to rounding. The value of trade for all surface modes is not equal to the sum of truck, rail and pipeline modes, it also includes shipments made by mail, foreign trade zones, and other transportation. For additional detail, please refer to the Data Fields section of the TransBorder web page:
https://data.bts.gov/stories/s/TransBorder-Freight-Data/myhq-rm6q/
TABLE 7. TOP 10 STATES TRADING WITH MEXICO BY ALL SURFACE MODES OF TRANSPORTATION
Ranked by December 2011 Surface Trade Value
(millions of dollars)
| State | December 2010 | December 2011 | Percent Change December 2010-2011 | ||
|---|---|---|---|---|---|
| Value | Rank | Value | Rank | ||
| Texas | 9,459 | 1 | 10,282 | 1 | 8.7 |
| California | 4,073 | 2 | 4,459 | 2 | 9.5 |
| Michigan | 2,922 | 3 | 3,649 | 3 | 24.9 |
| Illinois | 915 | 5 | 1,021 | 4 | 11.5 |
| Arizona | 979 | 4 | 994 | 5 | 1.5 |
| Ohio | 686 | 6 | 746 | 6 | 8.7 |
| Tennessee | 497 | 7 | 627 | 7 | 26.3 |
| North Carolina | 399 | 10 | 560 | 8 | 40.4 |
| Indiana | 445 | 8 | 509 | 9 | 14.2 |
| Connecticut | 397 | 11 | 465 | 10 | 17.0 |
SOURCE: BTS TransBorder Freight Data, https://data.bts.gov/stories/s/TransBorder-Freight-Data/myhq-rm6q/
NOTE: Percent changes based on numbers prior to rounding
TABLE 8. PERCENT OF U.S. TRADE BY VALUE WITH CANADA AND MEXICO BY MAJOR MODES
December 2011 (Current U.S. dollars)
| Mode | Total Trade Value | Percent |
|---|---|---|
| All Modes | 86,775,358,953 | 100.0 |
| All Surface Modes | 74,230,256,915 | 85.5 |
| Air | 3,870,958,239 | 4.5 |
| Vessel | 8,674,143,799 | 10.0 |
SOURCE: BTS TransBorder Freight Data. https://data.bts.gov/stories/s/TransBorder-Freight-Data/myhq-rm6q/
NOTE: Numbers might not add to totals due to rounding. Percent changes are based on current numbers prior to rounding (if applicable).