
Figure 1. Freight TSI modal data, January 2000-December 2016
Figure
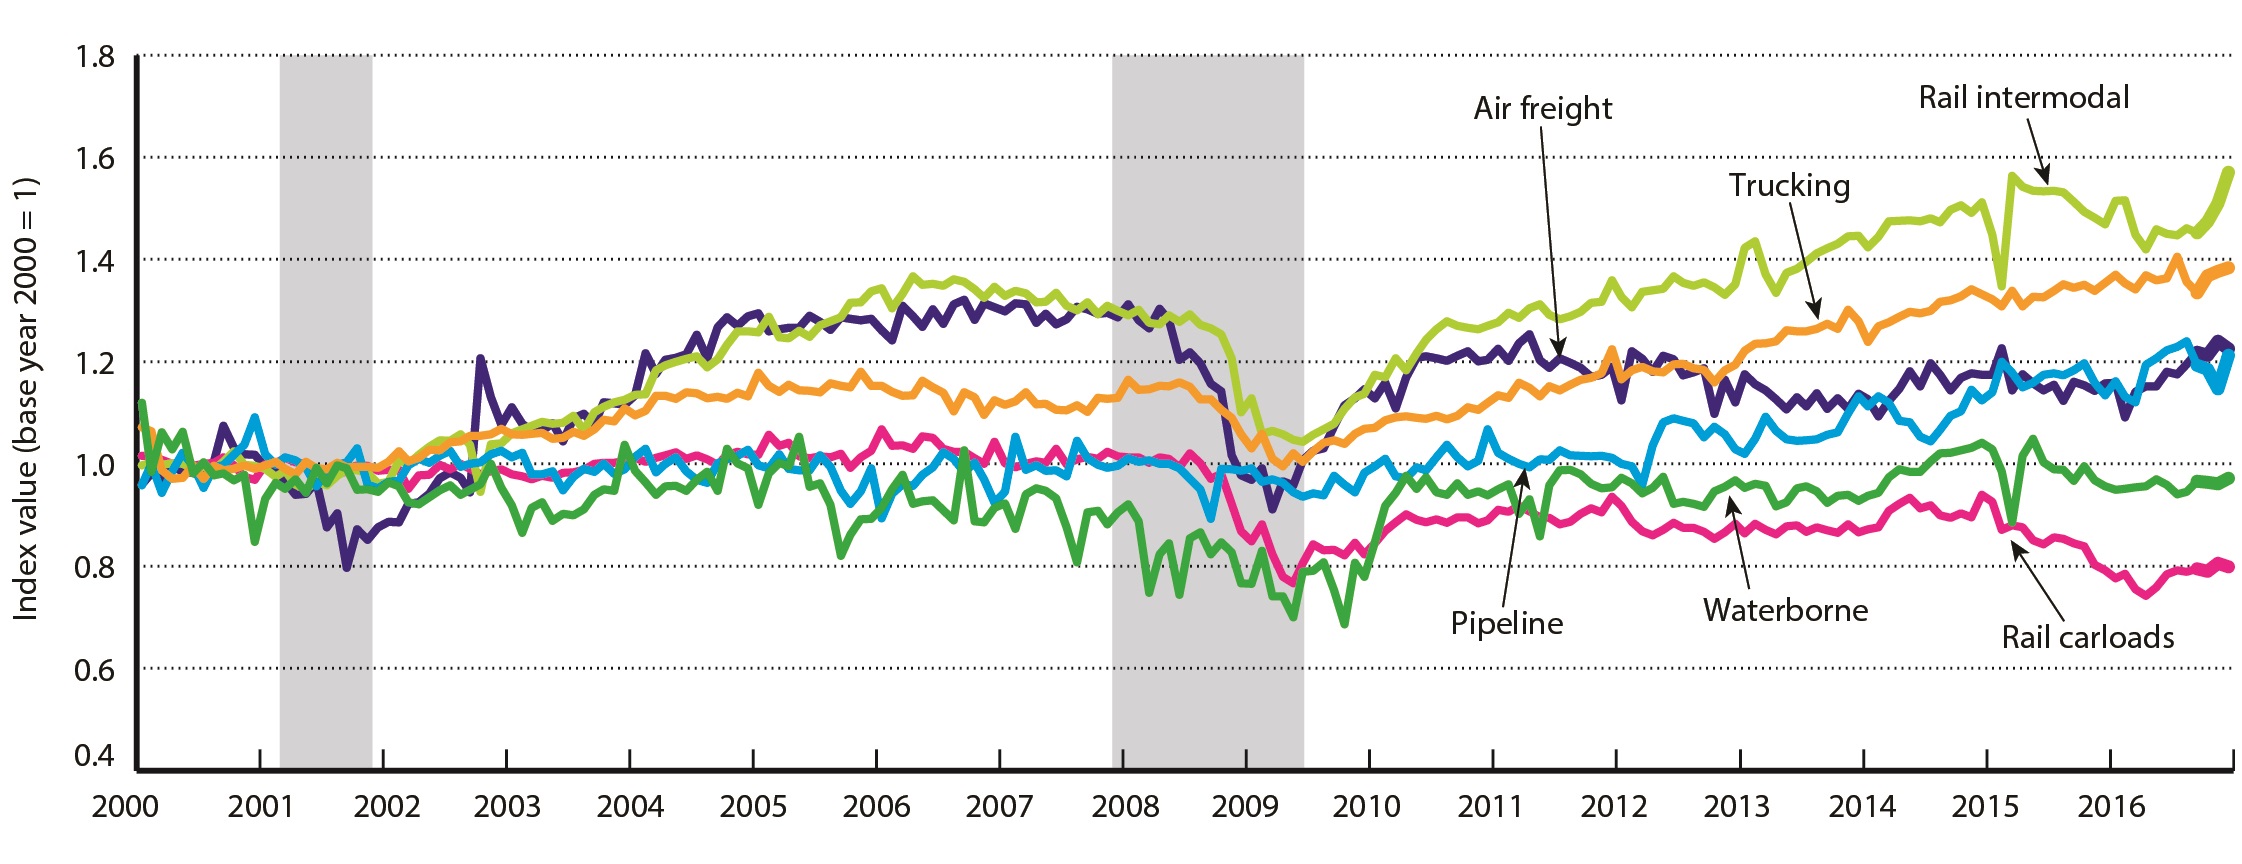
Dataset Table:
| Date | Air Freight | Rail Carloads | Rail Intermodal | Pipeline | Trucking | Waterborne | Recession |
|---|---|---|---|---|---|---|---|
| Jan-00 | 0.960 | 1.016 | 0.998 | 0.959 | 1.072 | 1.120 | 0 |
| Feb-00 | 0.982 | 1.015 | 1.003 | 1.000 | 1.065 | 0.985 | 0 |
| Mar-00 | 0.969 | 1.008 | 0.999 | 0.944 | 0.988 | 1.062 | 0 |
| Apr-00 | 0.997 | 1.001 | 1.002 | 0.986 | 0.971 | 1.029 | 0 |
| May-00 | 0.985 | 1.005 | 1.001 | 1.022 | 0.973 | 1.063 | 0 |
| Jun-00 | 0.983 | 0.997 | 0.990 | 0.996 | 0.997 | 0.982 | 0 |
| Jul-00 | 0.975 | 1.001 | 0.993 | 0.954 | 0.971 | 1.004 | 0 |
| Aug-00 | 1.005 | 1.002 | 0.990 | 0.995 | 0.996 | 0.978 | 0 |
| Sep-00 | 1.075 | 1.013 | 1.004 | 0.998 | 0.988 | 0.982 | 0 |
| Oct-00 | 1.032 | 0.997 | 1.025 | 1.018 | 0.991 | 0.968 | 0 |
| Nov-00 | 1.019 | 0.975 | 0.999 | 1.038 | 0.998 | 0.979 | 0 |
| Dec-00 | 1.018 | 0.969 | 0.996 | 1.091 | 0.991 | 0.848 | 0 |
| Jan-01 | 0.995 | 0.999 | 0.991 | 1.019 | 0.998 | 0.932 | 0 |
| Feb-01 | 0.992 | 1.002 | 0.975 | 0.998 | 1.005 | 0.964 | 0 |
| Mar-01 | 0.965 | 1.012 | 0.987 | 1.013 | 0.991 | 0.952 | 1 |
| Apr-01 | 0.940 | 1.003 | 0.960 | 1.007 | 0.980 | 0.970 | 1 |
| May-01 | 0.942 | 1.001 | 0.951 | 0.992 | 1.004 | 0.944 | 1 |
| Jun-01 | 0.965 | 0.992 | 0.966 | 0.957 | 0.992 | 0.993 | 1 |
| Jul-01 | 0.876 | 0.968 | 0.959 | 0.986 | 0.990 | 0.963 | 1 |
| Aug-01 | 0.903 | 0.982 | 0.977 | 0.998 | 1.002 | 0.998 | 1 |
| Sep-01 | 0.797 | 0.985 | 0.989 | 1.004 | 0.994 | 0.992 | 1 |
| Oct-01 | 0.873 | 0.998 | 0.988 | 1.031 | 0.994 | 0.949 | 1 |
| Nov-01 | 0.852 | 0.997 | 0.982 | 0.960 | 0.995 | 0.951 | 1 |
| Dec-01 | 0.877 | 0.987 | 0.962 | 0.952 | 0.992 | 0.946 | 0 |
| Jan-02 | 0.887 | 0.989 | 0.965 | 0.965 | 1.005 | 0.964 | 0 |
| Feb-02 | 0.886 | 0.989 | 1.007 | 0.967 | 1.025 | 0.957 | 0 |
| Mar-02 | 0.922 | 0.951 | 0.999 | 0.997 | 1.006 | 0.925 | 0 |
| Apr-02 | 0.925 | 0.978 | 1.018 | 1.010 | 1.012 | 0.921 | 0 |
| May-02 | 0.941 | 0.979 | 1.034 | 1.003 | 1.028 | 0.935 | 0 |
| Jun-02 | 0.972 | 0.999 | 1.047 | 1.016 | 1.027 | 0.949 | 0 |
| Jul-02 | 0.984 | 0.989 | 1.045 | 1.026 | 1.043 | 0.958 | 0 |
| Aug-02 | 0.973 | 1.000 | 1.058 | 0.995 | 1.044 | 0.940 | 0 |
| Sep-02 | 0.945 | 0.991 | 1.038 | 1.000 | 1.056 | 0.950 | 0 |
| Oct-02 | 1.207 | 0.980 | 0.946 | 1.004 | 1.055 | 0.961 | 0 |
| Nov-02 | 1.130 | 0.986 | 1.039 | 1.019 | 1.058 | 1.000 | 0 |
| Dec-02 | 1.077 | 0.990 | 1.041 | 1.026 | 1.069 | 0.954 | 0 |
| Jan-03 | 1.111 | 0.980 | 1.060 | 1.013 | 1.058 | 0.919 | 0 |
| Feb-03 | 1.079 | 0.977 | 1.068 | 1.022 | 1.057 | 0.866 | 0 |
| Mar-03 | 1.064 | 0.970 | 1.075 | 0.980 | 1.059 | 0.915 | 0 |
| Apr-03 | 1.065 | 0.977 | 1.083 | 0.980 | 1.061 | 0.925 | 0 |
| May-03 | 1.079 | 0.973 | 1.079 | 0.986 | 1.049 | 0.889 | 0 |
| Jun-03 | 1.045 | 0.982 | 1.081 | 0.949 | 1.051 | 0.903 | 0 |
| Jul-03 | 1.090 | 0.984 | 1.094 | 0.975 | 1.063 | 0.899 | 0 |
| Aug-03 | 1.099 | 0.988 | 1.066 | 0.991 | 1.055 | 0.912 | 0 |
| Sep-03 | 1.078 | 1.001 | 1.101 | 0.985 | 1.068 | 0.940 | 0 |
| Oct-03 | 1.121 | 1.003 | 1.112 | 1.001 | 1.086 | 0.951 | 0 |
| Nov-03 | 1.119 | 1.002 | 1.121 | 0.981 | 1.083 | 0.948 | 0 |
| Dec-03 | 1.116 | 1.006 | 1.126 | 0.990 | 1.109 | 1.037 | 0 |
| Jan-04 | 1.134 | 1.013 | 1.136 | 1.015 | 1.095 | 0.986 | 0 |
| Feb-04 | 1.217 | 1.004 | 1.137 | 1.030 | 1.104 | 0.964 | 0 |
| Mar-04 | 1.176 | 1.012 | 1.184 | 0.984 | 1.134 | 0.940 | 0 |
| Apr-04 | 1.204 | 1.017 | 1.193 | 1.000 | 1.133 | 0.956 | 0 |
| May-04 | 1.208 | 1.023 | 1.200 | 1.013 | 1.127 | 0.957 | 0 |
| Jun-04 | 1.215 | 1.010 | 1.206 | 0.986 | 1.140 | 0.947 | 0 |
| Jul-04 | 1.253 | 1.018 | 1.211 | 0.970 | 1.139 | 0.970 | 0 |
| Aug-04 | 1.207 | 1.010 | 1.190 | 0.963 | 1.128 | 0.985 | 0 |
| Sep-04 | 1.267 | 0.998 | 1.205 | 1.002 | 1.131 | 0.947 | 0 |
| Oct-04 | 1.287 | 1.018 | 1.234 | 1.010 | 1.128 | 1.030 | 0 |
| Nov-04 | 1.271 | 1.024 | 1.260 | 1.016 | 1.139 | 1.002 | 0 |
| Dec-04 | 1.289 | 1.019 | 1.260 | 1.028 | 1.132 | 0.992 | 0 |
| Jan-05 | 1.295 | 1.018 | 1.258 | 0.998 | 1.179 | 0.920 | 0 |
| Feb-05 | 1.260 | 1.058 | 1.288 | 0.992 | 1.153 | 0.982 | 0 |
| Mar-05 | 1.264 | 1.036 | 1.248 | 1.019 | 1.142 | 1.002 | 0 |
| Apr-05 | 1.267 | 1.041 | 1.246 | 0.991 | 1.155 | 0.996 | 0 |
| May-05 | 1.266 | 1.015 | 1.260 | 0.987 | 1.144 | 1.053 | 0 |
| Jun-05 | 1.290 | 1.012 | 1.249 | 0.988 | 1.143 | 0.955 | 0 |
| Jul-05 | 1.279 | 1.015 | 1.271 | 1.018 | 1.140 | 0.962 | 0 |
| Aug-05 | 1.262 | 1.014 | 1.279 | 0.995 | 1.158 | 0.920 | 0 |
| Sep-05 | 1.287 | 1.020 | 1.287 | 0.948 | 1.153 | 0.820 | 0 |
| Oct-05 | 1.284 | 0.993 | 1.315 | 0.922 | 1.150 | 0.862 | 0 |
| Nov-05 | 1.281 | 1.013 | 1.317 | 0.947 | 1.181 | 0.892 | 0 |
| Dec-05 | 1.284 | 1.026 | 1.338 | 0.992 | 1.153 | 0.893 | 0 |
| Jan-06 | 1.261 | 1.068 | 1.344 | 0.894 | 1.153 | 0.915 | 0 |
| Feb-06 | 1.242 | 1.036 | 1.304 | 0.942 | 1.141 | 0.951 | 0 |
| Mar-06 | 1.310 | 1.037 | 1.333 | 0.960 | 1.134 | 0.979 | 0 |
| Apr-06 | 1.289 | 1.030 | 1.367 | 0.958 | 1.134 | 0.923 | 0 |
| May-06 | 1.268 | 1.054 | 1.350 | 0.979 | 1.163 | 0.928 | 0 |
| Jun-06 | 1.303 | 1.051 | 1.352 | 0.994 | 1.150 | 0.929 | 0 |
| Jul-06 | 1.275 | 1.029 | 1.349 | 1.023 | 1.140 | 0.909 | 0 |
| Aug-06 | 1.312 | 1.024 | 1.361 | 1.010 | 1.103 | 0.890 | 0 |
| Sep-06 | 1.321 | 1.024 | 1.356 | 0.984 | 1.140 | 1.027 | 0 |
| Oct-06 | 1.282 | 1.012 | 1.342 | 1.003 | 1.130 | 0.888 | 0 |
| Nov-06 | 1.315 | 1.001 | 1.325 | 0.970 | 1.097 | 0.886 | 0 |
| Dec-06 | 1.307 | 1.043 | 1.347 | 0.924 | 1.125 | 0.914 | 0 |
| Jan-07 | 1.298 | 1.001 | 1.329 | 0.946 | 1.116 | 0.923 | 0 |
| Feb-07 | 1.314 | 0.994 | 1.339 | 1.053 | 1.122 | 0.873 | 0 |
| Mar-07 | 1.312 | 1.001 | 1.334 | 0.989 | 1.140 | 0.941 | 0 |
| Apr-07 | 1.276 | 1.006 | 1.316 | 0.997 | 1.117 | 0.953 | 0 |
| May-07 | 1.294 | 1.003 | 1.318 | 0.987 | 1.118 | 0.948 | 0 |
| Jun-07 | 1.274 | 1.030 | 1.335 | 0.988 | 1.106 | 0.933 | 0 |
| Jul-07 | 1.283 | 0.999 | 1.310 | 0.976 | 1.106 | 0.876 | 0 |
| Aug-07 | 1.308 | 1.010 | 1.301 | 1.045 | 1.115 | 0.808 | 0 |
| Sep-07 | 1.303 | 1.014 | 1.317 | 1.011 | 1.103 | 0.905 | 0 |
| Oct-07 | 1.294 | 1.010 | 1.293 | 0.998 | 1.129 | 0.909 | 0 |
| Nov-07 | 1.296 | 1.024 | 1.310 | 0.993 | 1.127 | 0.882 | 0 |
| Dec-07 | 1.287 | 1.015 | 1.300 | 0.997 | 1.130 | 0.905 | 1 |
| Jan-08 | 1.313 | 1.013 | 1.291 | 1.011 | 1.165 | 0.921 | 1 |
| Feb-08 | 1.281 | 1.014 | 1.302 | 1.004 | 1.145 | 0.888 | 1 |
| Mar-08 | 1.265 | 1.003 | 1.277 | 1.007 | 1.146 | 0.748 | 1 |
| Apr-08 | 1.303 | 1.013 | 1.273 | 1.000 | 1.153 | 0.823 | 1 |
| May-08 | 1.281 | 1.011 | 1.291 | 1.000 | 1.152 | 0.845 | 1 |
| Jun-08 | 1.204 | 0.993 | 1.279 | 0.992 | 1.160 | 0.745 | 1 |
| Jul-08 | 1.219 | 1.021 | 1.293 | 0.972 | 1.151 | 0.854 | 1 |
| Aug-08 | 1.197 | 1.001 | 1.272 | 0.950 | 1.126 | 0.867 | 1 |
| Sep-08 | 1.157 | 0.971 | 1.266 | 0.893 | 1.126 | 0.824 | 1 |
| Oct-08 | 1.142 | 0.981 | 1.254 | 0.990 | 1.106 | 0.847 | 1 |
| Nov-08 | 1.017 | 0.923 | 1.207 | 0.990 | 1.090 | 0.828 | 1 |
| Dec-08 | 0.978 | 0.868 | 1.101 | 0.987 | 1.059 | 0.767 | 1 |
| Jan-09 | 0.970 | 0.849 | 1.128 | 0.991 | 1.031 | 0.766 | 1 |
| Feb-09 | 0.992 | 0.882 | 1.059 | 0.965 | 1.059 | 0.831 | 1 |
| Mar-09 | 0.912 | 0.824 | 1.065 | 0.970 | 1.010 | 0.742 | 1 |
| Apr-09 | 0.966 | 0.779 | 1.058 | 0.963 | 0.996 | 0.742 | 1 |
| May-09 | 0.959 | 0.767 | 1.047 | 0.945 | 1.021 | 0.700 | 1 |
| Jun-09 | 1.007 | 0.805 | 1.044 | 0.936 | 1.004 | 0.789 | 1 |
| Jul-09 | 1.026 | 0.843 | 1.057 | 0.942 | 1.025 | 0.791 | 0 |
| Aug-09 | 1.031 | 0.832 | 1.068 | 0.939 | 1.042 | 0.808 | 0 |
| Sep-09 | 1.074 | 0.833 | 1.079 | 0.977 | 1.047 | 0.753 | 0 |
| Oct-09 | 1.115 | 0.821 | 1.108 | 0.959 | 1.040 | 0.686 | 0 |
| Nov-09 | 1.129 | 0.846 | 1.130 | 0.945 | 1.059 | 0.807 | 0 |
| Dec-09 | 1.146 | 0.823 | 1.137 | 0.983 | 1.069 | 0.780 | 0 |
| Jan-10 | 1.129 | 0.845 | 1.175 | 0.996 | 1.071 | 0.847 | 0 |
| Feb-10 | 1.159 | 0.869 | 1.170 | 1.011 | 1.086 | 0.918 | 0 |
| Mar-10 | 1.109 | 0.886 | 1.207 | 0.976 | 1.091 | 0.943 | 0 |
| Apr-10 | 1.170 | 0.901 | 1.183 | 0.972 | 1.094 | 0.977 | 0 |
| May-10 | 1.208 | 0.891 | 1.217 | 0.994 | 1.090 | 0.951 | 0 |
| Jun-10 | 1.210 | 0.886 | 1.243 | 0.988 | 1.089 | 0.974 | 0 |
| Jul-10 | 1.207 | 0.892 | 1.264 | 1.013 | 1.094 | 0.945 | 0 |
| Aug-10 | 1.202 | 0.885 | 1.279 | 1.037 | 1.087 | 0.940 | 0 |
| Sep-10 | 1.212 | 0.896 | 1.271 | 1.013 | 1.095 | 0.963 | 0 |
| Oct-10 | 1.221 | 0.896 | 1.267 | 0.996 | 1.111 | 0.940 | 0 |
| Nov-10 | 1.201 | 0.884 | 1.263 | 1.006 | 1.106 | 0.946 | 0 |
| Dec-10 | 1.204 | 0.890 | 1.270 | 1.068 | 1.120 | 0.939 | 0 |
| Jan-11 | 1.226 | 0.910 | 1.277 | 1.022 | 1.135 | 0.951 | 0 |
| Feb-11 | 1.202 | 0.907 | 1.296 | 1.010 | 1.130 | 0.960 | 0 |
| Mar-11 | 1.237 | 0.918 | 1.286 | 1.001 | 1.159 | 0.903 | 0 |
| Apr-11 | 1.254 | 0.908 | 1.305 | 0.993 | 1.149 | 0.931 | 0 |
| May-11 | 1.203 | 0.896 | 1.312 | 1.010 | 1.132 | 0.859 | 0 |
| Jun-11 | 1.188 | 0.895 | 1.292 | 1.009 | 1.153 | 0.958 | 0 |
| Jul-11 | 1.207 | 0.882 | 1.283 | 1.027 | 1.144 | 0.987 | 0 |
| Aug-11 | 1.198 | 0.887 | 1.289 | 1.017 | 1.155 | 0.989 | 0 |
| Sep-11 | 1.188 | 0.903 | 1.298 | 1.017 | 1.164 | 0.980 | 0 |
| Oct-11 | 1.171 | 0.914 | 1.315 | 1.015 | 1.169 | 0.961 | 0 |
| Nov-11 | 1.174 | 0.906 | 1.318 | 1.016 | 1.178 | 0.953 | 0 |
| Dec-11 | 1.190 | 0.936 | 1.360 | 1.012 | 1.224 | 0.954 | 0 |
| Jan-12 | 1.125 | 0.918 | 1.327 | 1.000 | 1.166 | 0.973 | 0 |
| Feb-12 | 1.221 | 0.887 | 1.307 | 0.996 | 1.183 | 0.963 | 0 |
| Mar-12 | 1.206 | 0.868 | 1.337 | 0.960 | 1.190 | 0.943 | 0 |
| Apr-12 | 1.181 | 0.860 | 1.340 | 1.037 | 1.182 | 0.953 | 0 |
| May-12 | 1.212 | 0.871 | 1.343 | 1.082 | 1.179 | 0.975 | 0 |
| Jun-12 | 1.204 | 0.885 | 1.368 | 1.090 | 1.195 | 0.923 | 0 |
| Jul-12 | 1.174 | 0.875 | 1.355 | 1.084 | 1.196 | 0.927 | 0 |
| Aug-12 | 1.180 | 0.875 | 1.348 | 1.080 | 1.187 | 0.922 | 0 |
| Sep-12 | 1.188 | 0.868 | 1.355 | 1.052 | 1.184 | 0.916 | 0 |
| Oct-12 | 1.098 | 0.854 | 1.346 | 1.073 | 1.160 | 0.947 | 0 |
| Nov-12 | 1.165 | 0.867 | 1.331 | 1.058 | 1.183 | 0.956 | 0 |
| Dec-12 | 1.120 | 0.883 | 1.351 | 1.029 | 1.194 | 0.968 | 0 |
| Jan-13 | 1.176 | 0.865 | 1.423 | 1.020 | 1.222 | 0.954 | 0 |
| Feb-13 | 1.156 | 0.883 | 1.436 | 1.050 | 1.235 | 0.961 | 0 |
| Mar-13 | 1.144 | 0.871 | 1.371 | 1.092 | 1.236 | 0.958 | 0 |
| Apr-13 | 1.127 | 0.863 | 1.335 | 1.065 | 1.240 | 0.917 | 0 |
| May-13 | 1.107 | 0.878 | 1.374 | 1.048 | 1.262 | 0.925 | 0 |
| Jun-13 | 1.130 | 0.880 | 1.382 | 1.046 | 1.260 | 0.953 | 0 |
| Jul-13 | 1.113 | 0.867 | 1.395 | 1.047 | 1.259 | 0.957 | 0 |
| Aug-13 | 1.138 | 0.877 | 1.413 | 1.048 | 1.265 | 0.947 | 0 |
| Sep-13 | 1.108 | 0.870 | 1.422 | 1.058 | 1.274 | 0.925 | 0 |
| Oct-13 | 1.128 | 0.866 | 1.431 | 1.062 | 1.265 | 0.938 | 0 |
| Nov-13 | 1.108 | 0.883 | 1.445 | 1.099 | 1.302 | 0.940 | 0 |
| Dec-13 | 1.138 | 0.867 | 1.446 | 1.132 | 1.279 | 0.928 | 0 |
| Jan-14 | 1.127 | 0.873 | 1.424 | 1.113 | 1.239 | 0.937 | 0 |
| Feb-14 | 1.093 | 0.876 | 1.444 | 1.133 | 1.269 | 0.944 | 0 |
| Mar-14 | 1.124 | 0.909 | 1.474 | 1.120 | 1.278 | 0.974 | 0 |
| Apr-14 | 1.148 | 0.923 | 1.476 | 1.085 | 1.288 | 0.989 | 0 |
| May-14 | 1.181 | 0.934 | 1.477 | 1.082 | 1.298 | 0.985 | 0 |
| Jun-14 | 1.152 | 0.913 | 1.475 | 1.054 | 1.295 | 0.985 | 0 |
| Jul-14 | 1.197 | 0.920 | 1.481 | 1.045 | 1.300 | 1.006 | 0 |
| Aug-14 | 1.175 | 0.900 | 1.473 | 1.067 | 1.317 | 1.021 | 0 |
| Sep-14 | 1.145 | 0.895 | 1.497 | 1.095 | 1.321 | 1.022 | 0 |
| Oct-14 | 1.169 | 0.903 | 1.506 | 1.103 | 1.328 | 1.027 | 0 |
| Nov-14 | 1.178 | 0.896 | 1.491 | 1.145 | 1.342 | 1.031 | 0 |
| Dec-14 | 1.174 | 0.940 | 1.512 | 1.125 | 1.332 | 1.041 | 0 |
| Jan-15 | 1.175 | 0.926 | 1.449 | 1.140 | 1.322 | 1.029 | 0 |
| Feb-15 | 1.227 | 0.872 | 1.347 | 1.200 | 1.309 | 0.985 | 0 |
| Mar-15 | 1.144 | 0.880 | 1.564 | 1.178 | 1.339 | 0.886 | 0 |
| Apr-15 | 1.176 | 0.877 | 1.543 | 1.150 | 1.309 | 1.016 | 0 |
| May-15 | 1.158 | 0.851 | 1.534 | 1.159 | 1.327 | 1.050 | 0 |
| Jun-15 | 1.145 | 0.843 | 1.534 | 1.174 | 1.326 | 1.003 | 0 |
| Jul-15 | 1.155 | 0.857 | 1.534 | 1.178 | 1.339 | 0.990 | 0 |
| Aug-15 | 1.123 | 0.854 | 1.531 | 1.174 | 1.351 | 0.988 | 0 |
| Sep-15 | 1.161 | 0.845 | 1.513 | 1.183 | 1.345 | 0.967 | 0 |
| Oct-15 | 1.154 | 0.839 | 1.494 | 1.198 | 1.351 | 0.996 | 0 |
| Nov-15 | 1.143 | 0.803 | 1.482 | 1.159 | 1.339 | 0.968 | 0 |
| Dec-15 | 1.158 | 0.792 | 1.469 | 1.135 | 1.355 | 0.957 | 0 |
| Jan-16 | 1.159 | 0.776 | 1.515 | 1.162 | 1.370 | 0.950 | 0 |
| Feb-16 | 1.092 | 0.785 | 1.516 | 1.132 | 1.353 | 0.951 | 0 |
| Mar-16 | 1.141 | 0.755 | 1.449 | 1.121 | 1.342 | 0.955 | 0 |
| Apr-16 | 1.152 | 0.742 | 1.420 | 1.195 | 1.369 | 0.957 | 0 |
| May-16 | 1.152 | 0.759 | 1.459 | 1.207 | 1.360 | 0.971 | 0 |
| Jun-16 | 1.180 | 0.785 | 1.451 | 1.222 | 1.363 | 0.959 | 0 |
| Jul-16 | 1.176 | 0.792 | 1.448 | 1.229 | 1.405 | 0.941 | 0 |
| Aug-16 | 1.195 | 0.789 | 1.461 | 1.240 | 1.356 | 0.946 | 0 |
| Sep-16 | 1.218 | 0.795 | 1.452 | 1.193 | 1.335 | 0.967 | 0 |
| Oct-16 | 1.213 | 0.790 | 1.474 | 1.186 | 1.369 | 0.964 | 0 |
| Nov-16 | 1.241 | 0.806 | 1.511 | 1.147 | 1.378 | 0.961 | 0 |
| Dec-16 | 1.226 | 0.799 | 1.571 | 1.213 | 1.384 | 0.972 | 0 |
Notes:
Data are seasonally adjusted and indexed. Economic recessions as defined by the National Bureau of Economic Research
Source:
U.S. Department of Transportation, Bureau of Transportation Statistics, seasonally adjusted transportation data, available at www.bts.gov