
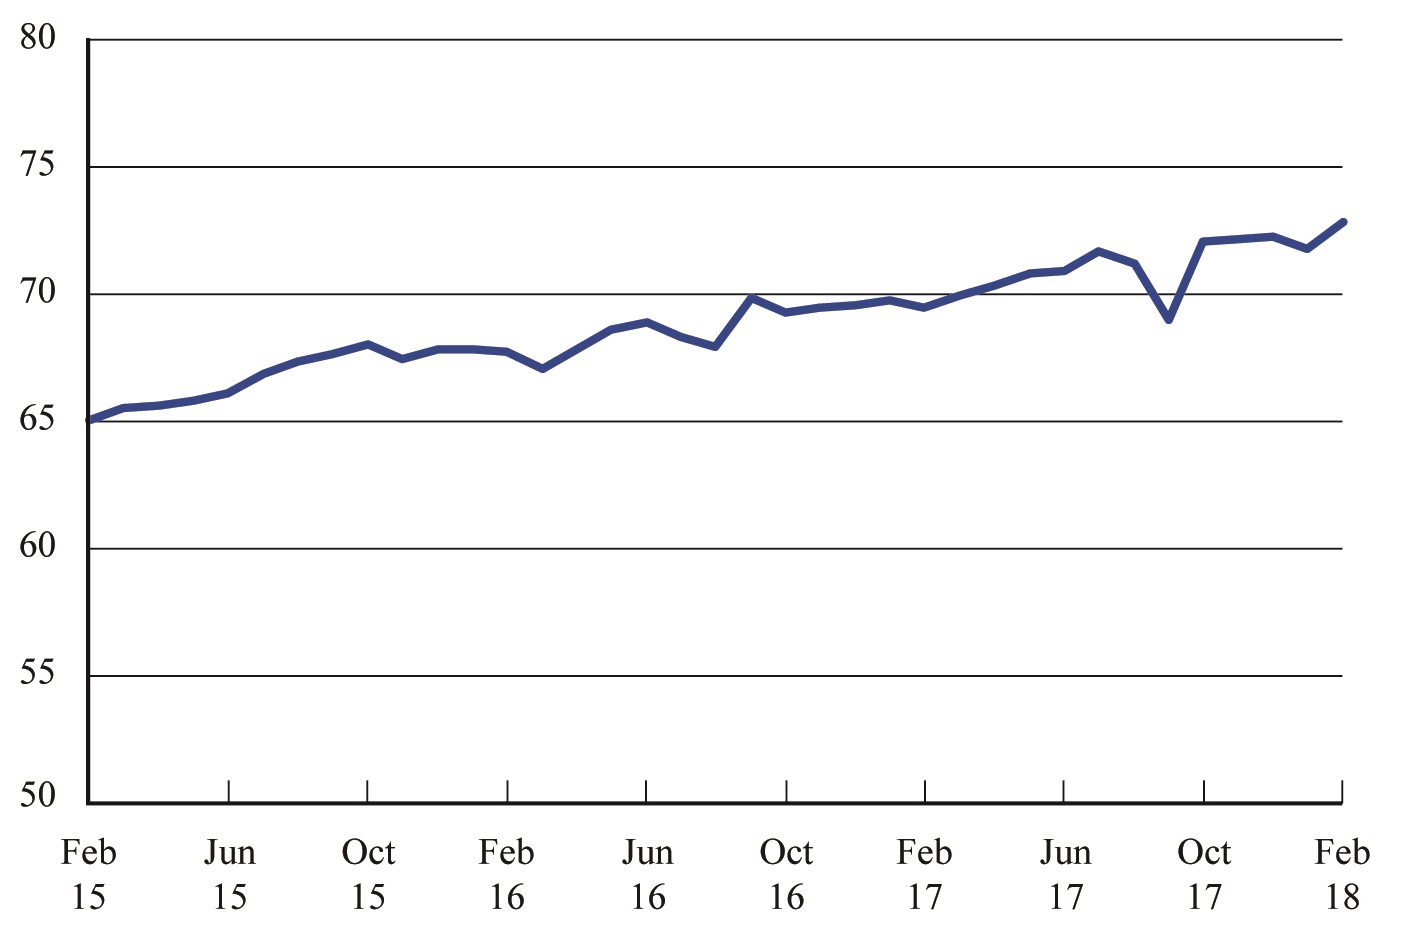
Figure 1. Seasonally-Adjusted Systemwide Passenger Enplanements on All U.S. Scheduled Airlines (Domestic & International), February 2015 - February 2018
Enplanements in millions (Seasonally Adjusted)
Figure
Dataset Table:
| Enplanements in millions (Seasonally Adjusted) | |
|---|---|
| Feb-15 | 65.0 |
| Mar-15 | 65.6 |
| Apr-15 | 65.6 |
| May-15 | 65.8 |
| Jun-15 | 66.1 |
| Jul-15 | 66.9 |
| Aug-15 | 67.4 |
| Sep-15 | 67.7 |
| Oct-15 | 68.0 |
| Nov-15 | 67.5 |
| Dec-15 | 67.9 |
| Jan-16 | 67.8 |
| Feb-16 | 67.7 |
| Mar-16 | 67.1 |
| Apr-16 | 67.9 |
| May-16 | 68.6 |
| Jun-16 | 68.9 |
| Jul-16 | 68.4 |
| Aug-16 | 68.0 |
| Sep-16 | 69.8 |
| Oct-16 | 69.3 |
| Nov-16 | 69.5 |
| Dec-16 | 69.6 |
| Jan-17 | 69.8 |
| Feb-17 | 69.5 |
| Mar-17 | 69.9 |
| Apr-17 | 70.4 |
| May-17 | 70.9 |
| Jun-17 | 70.9 |
| Jul-17 | 71.7 |
| Aug-17 | 71.2 |
| Sep-17 | 69.0 |
| Oct-17 | 72.1 |
| Nov-17 | 72.2 |
| Dec-17 | 72.3 |
| Jan-18 | 71.8 |
| Feb-18 | 72.8 |