
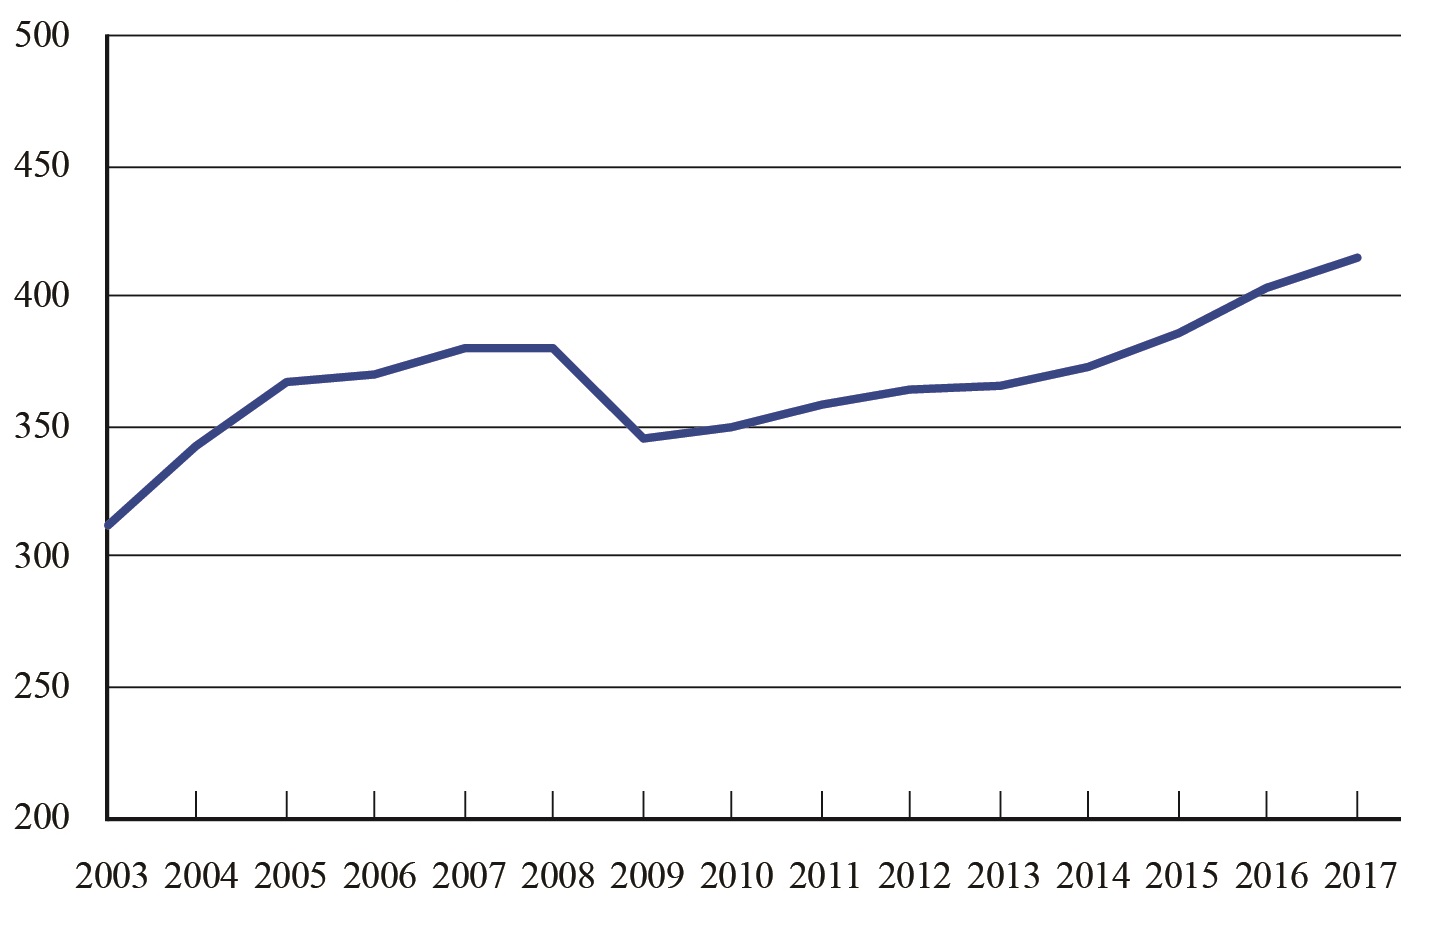
Figure 1. Semi-Annual Passengers on All U.S. Scheduled Airlines (Domestic & International), 2003-2017, June 2017
Passengers (in millions)
Figure
Dataset Table:
| Figure 1. Semi-Annual Passengers on All U.S. Scheduled Airlines (Domestic & International), 2003-2017 | |
|---|---|
| Passengers (in millions) | |
| 2003 | 312.6 |
| 2004 | 342.1 |
| 2005 | 366.3 |
| 2006 | 369.6 |
| 2007 | 379.7 |
| 2008 | 379.7 |
| 2009 | 345.5 |
| 2010 | 349.6 |
| 2011 | 358.0 |
| 2012 | 363.8 |
| 2013 | 365.8 |
| 2014 | 373.3 |
| 2015 | 386.3 |
| 2016 | 403.1 |
| 2017 | 414.4 |
Source:
Bureau of Transportation Statistics, T-100 Market