
Figure 1. U.S. Average Domestic Fares, 1st Quarter 1995-2018
Figure
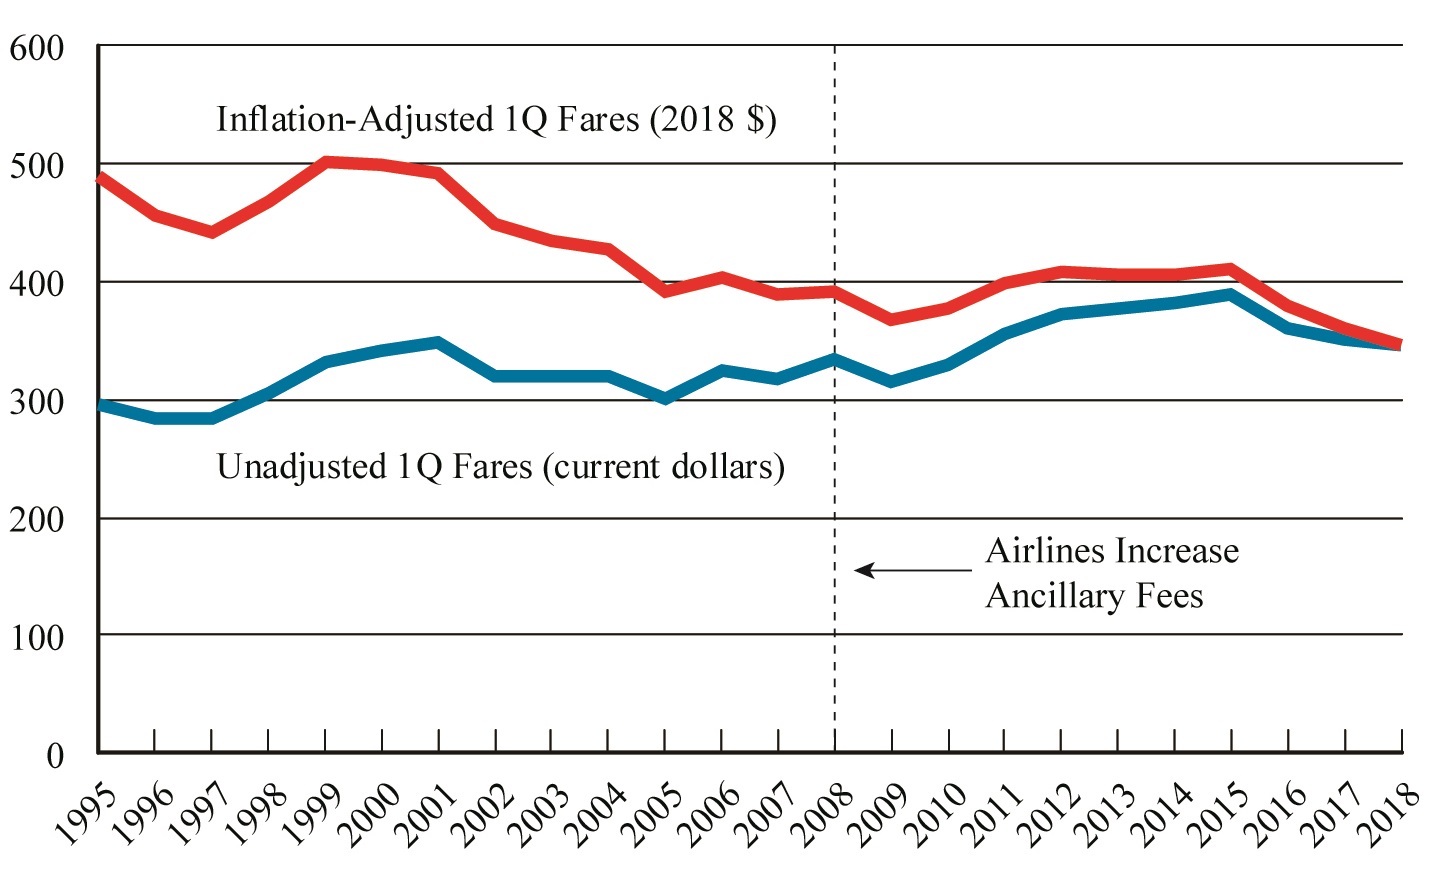
Dataset Table:
| Unadjusted 1Q Fares (current dollars) | Inflation-Adjusted 1Q Fares (2018 $) | |
|---|---|---|
| 1995 | 297 | 490 |
| 1996 | 284 | 456 |
| 1997 | 283 | 442 |
| 1998 | 305 | 468 |
| 1999 | 332 | 501 |
| 2000 | 340 | 498 |
| 2001 | 348 | 492 |
| 2002 | 320 | 448 |
| 2003 | 319 | 434 |
| 2004 | 320 | 428 |
| 2005 | 301 | 391 |
| 2006 | 323 | 404 |
| 2007 | 318 | 388 |
| 2008 | 333 | 391 |
| 2009 | 314 | 368 |
| 2010 | 328 | 376 |
| 2011 | 356 | 399 |
| 2012 | 373 | 407 |
| 2013 | 378 | 406 |
| 2014 | 382 | 405 |
| 2015 | 388 | 411 |
| 2016 | 361 | 379 |
| 2017 | 352 | 360 |
| 2018 | 346 | 346 |
Source:
Bureau of Transportation Statistics, Origin and Destination Survey