
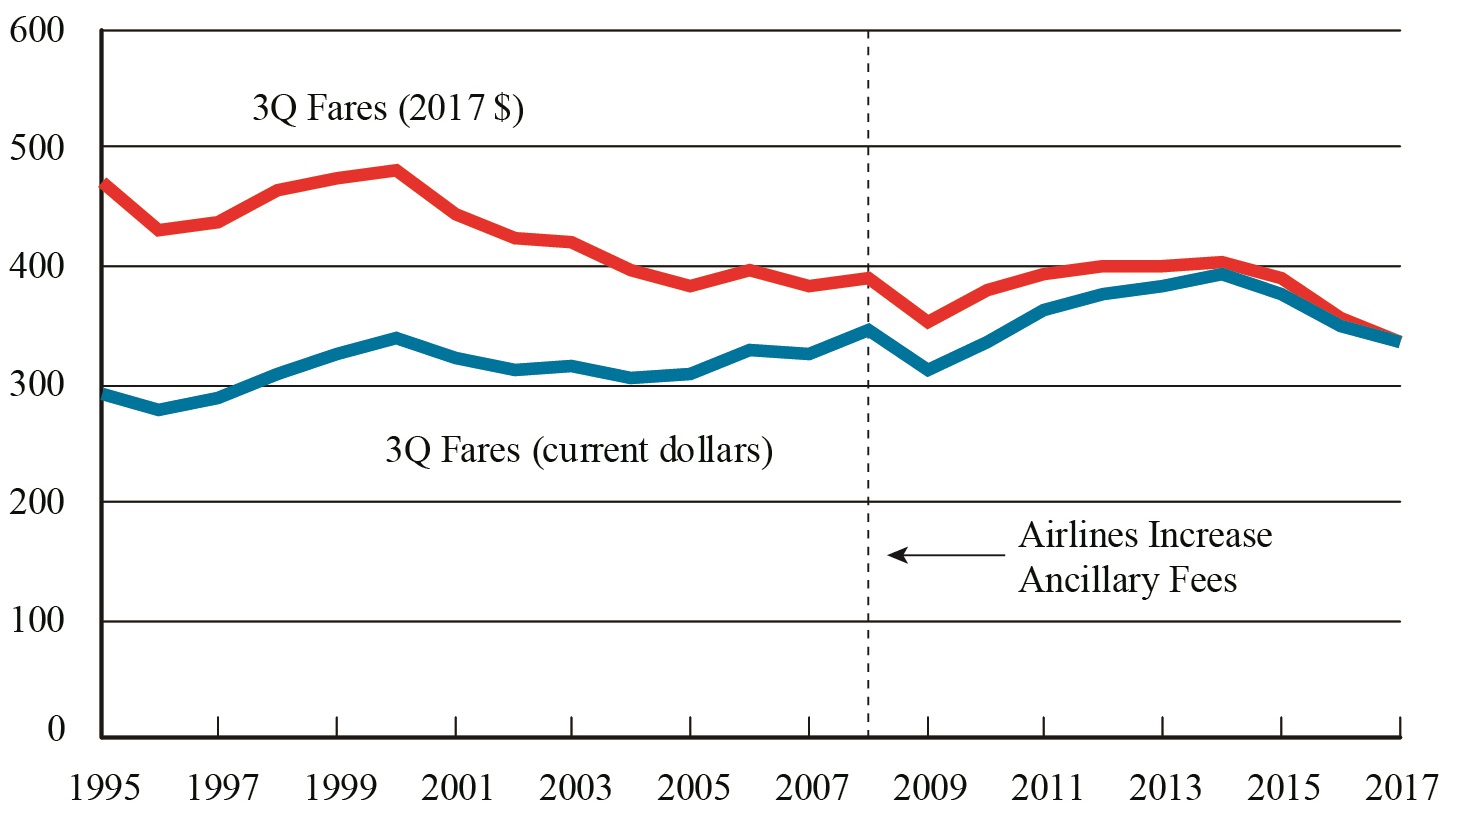
Figure 1. U.S. Average Domestic Fares, 3rd Quarter 1995-2017
Figure
Dataset Table:
| 3Q Fares (current dollars) | 3Q Fares (2017 $) | |
|---|---|---|
| 1995 | 292 | 470 |
| 1996 | 277 | 432 |
| 1997 | 287 | 439 |
| 1998 | 309 | 465 |
| 1999 | 324 | 476 |
| 2000 | 339 | 481 |
| 2001 | 321 | 443 |
| 2002 | 312 | 425 |
| 2003 | 315 | 420 |
| 2004 | 305 | 396 |
| 2005 | 307 | 384 |
| 2006 | 329 | 397 |
| 2007 | 325 | 384 |
| 2008 | 346 | 388 |
| 2009 | 310 | 353 |
| 2010 | 336 | 378 |
| 2011 | 364 | 395 |
| 2012 | 375 | 400 |
| 2013 | 382 | 401 |
| 2014 | 392 | 404 |
| 2015 | 377 | 389 |
| 2016 | 349 | 356 |
| 2017 | 336 | 336 |
Source:
Bureau of Transportation Statistics, Origin and Destination Survey: DB1BTicket