
Figure 1. U.S. Average Domestic Fares, 4th Quarter 1995-2016
Figure
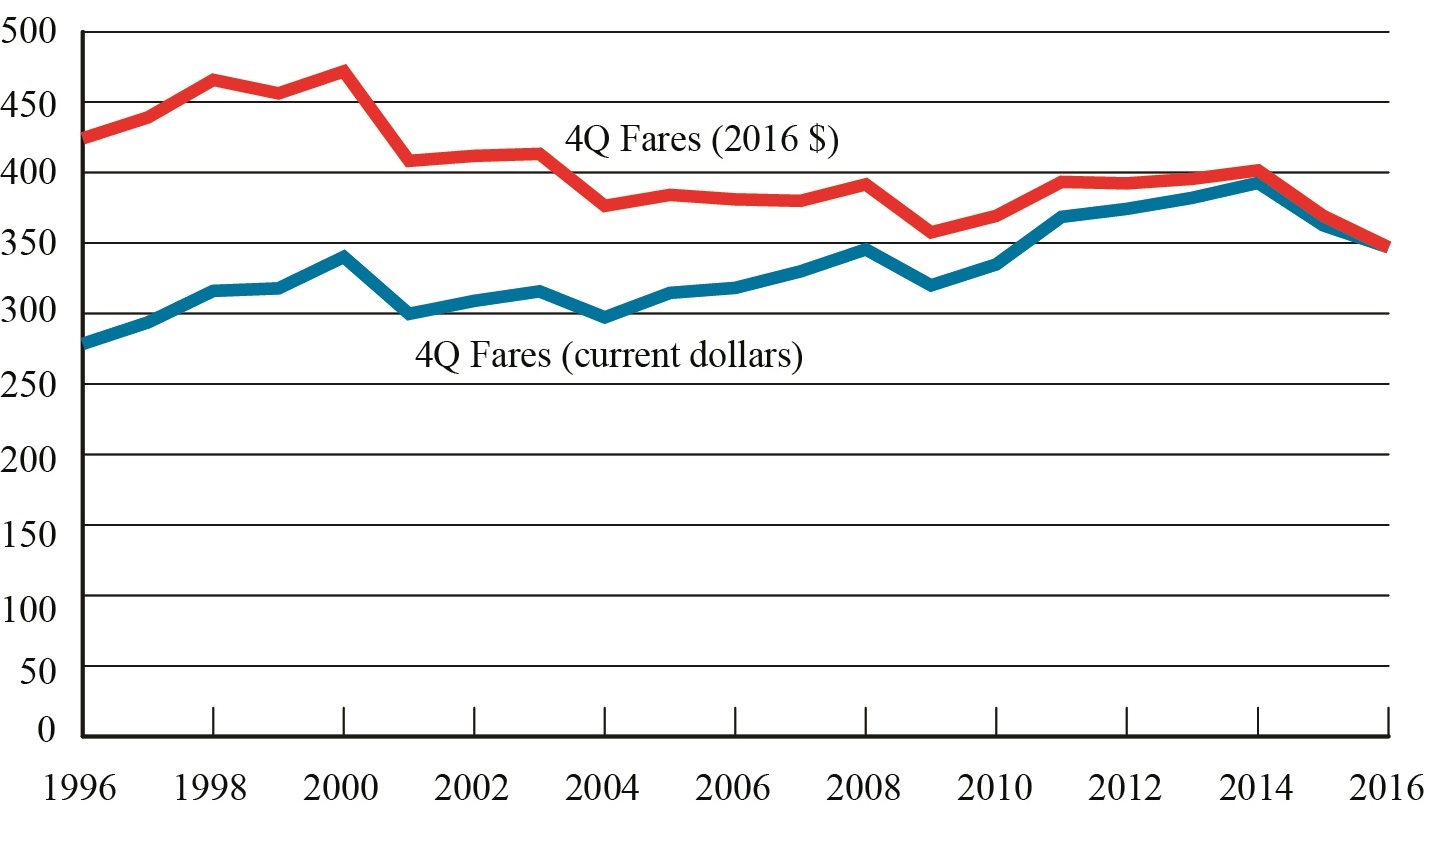
Dataset Table:
| 4Q Fares (current dollars) | 4Q Fares (2016 $) | |
|---|---|---|
| 1995 | 288 | 452 |
| 1996 | 278 | 424 |
| 1997 | 294 | 439 |
| 1998 | 316 | 466 |
| 1999 | 318 | 456 |
| 2000 | 340 | 472 |
| 2001 | 300 | 408 |
| 2002 | 309 | 412 |
| 2003 | 316 | 413 |
| 2004 | 297 | 376 |
| 2005 | 315 | 384 |
| 2006 | 318 | 381 |
| 2007 | 330 | 380 |
| 2008 | 345 | 392 |
| 2009 | 320 | 357 |
| 2010 | 335 | 369 |
| 2011 | 368 | 393 |
| 2012 | 374 | 392 |
| 2013 | 382 | 396 |
| 2014 | 393 | 402 |
| 2015 | 363 | 369 |
| 2016 | 347 | 347 |
Source:
Bureau of Transportation Statistics, Origin and Destination Survey: DB1BTicket