
Figure 1. U.S. Average Domestic Fares,1st Quarter 1995-2017
Figure
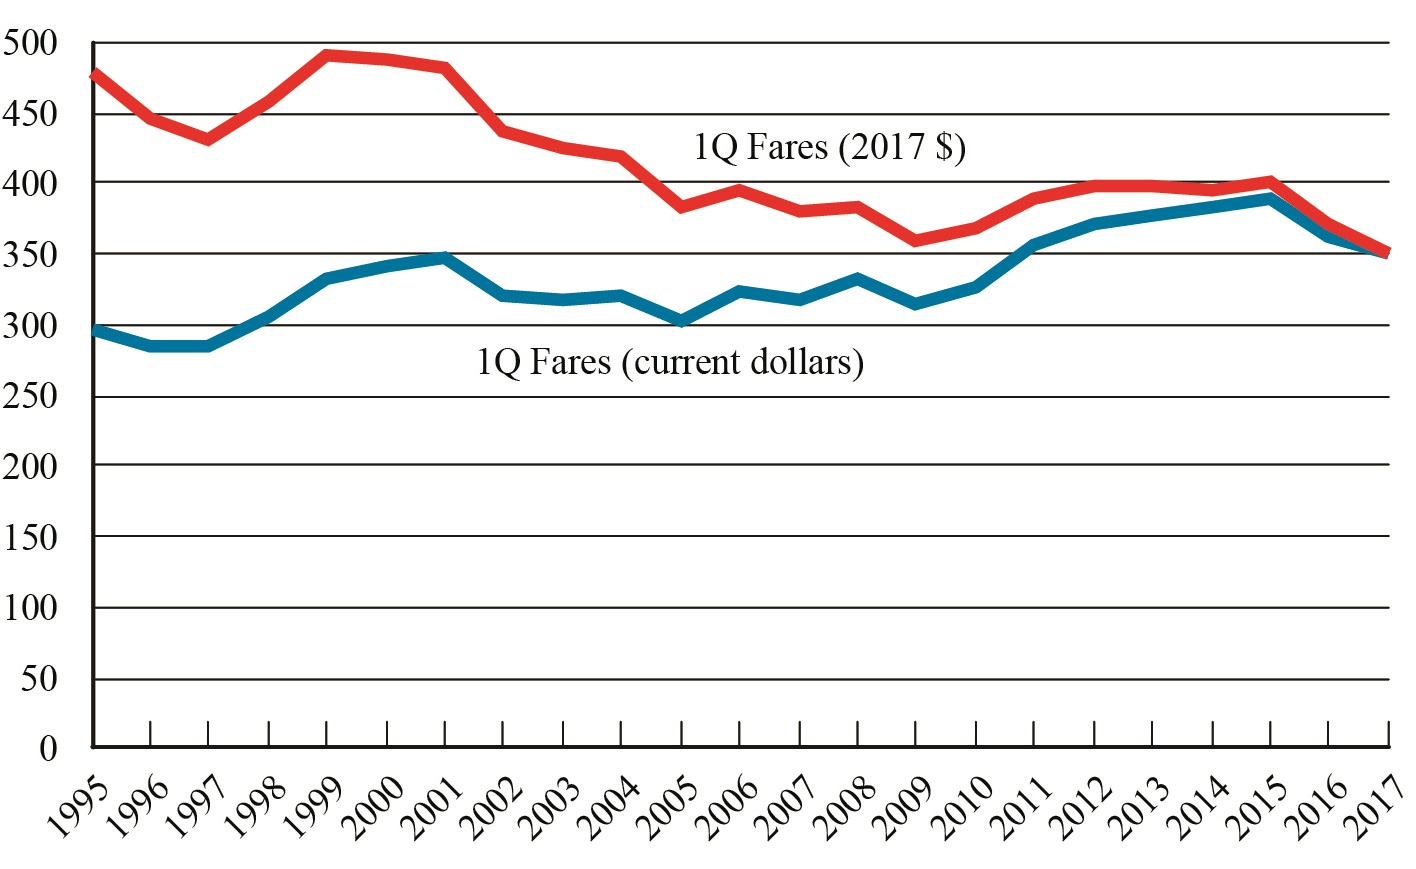
Dataset Table:
| Figure 1. U.S. Average Domestic Fares,1st Quarter 1995-2017 | ||
|---|---|---|
| 1Q Fares (current dollars) | 1Q Fares (2017 $) | |
| 1995 | 297 | 479 |
| 1996 | 284 | 446 |
| 1997 | 283 | 432 |
| 1998 | 305 | 458 |
| 1999 | 332 | 491 |
| 2000 | 340 | 487 |
| 2001 | 348 | 482 |
| 2002 | 320 | 438 |
| 2003 | 319 | 425 |
| 2004 | 320 | 418 |
| 2005 | 301 | 382 |
| 2006 | 323 | 396 |
| 2007 | 318 | 380 |
| 2008 | 333 | 383 |
| 2009 | 314 | 360 |
| 2010 | 328 | 368 |
| 2011 | 356 | 391 |
| 2012 | 373 | 398 |
| 2013 | 378 | 397 |
| 2014 | 382 | 396 |
| 2015 | 388 | 402 |
| 2016 | 361 | 370 |
| 2017 | 352 | 352 |
Source:
Bureau of Transportation Statistics, Origin and Destination Survey: DB1BTicket