
Figure 2. Fares by Airport Group based on Number of Originating Domestic Passengers 1Q 2018
Figure
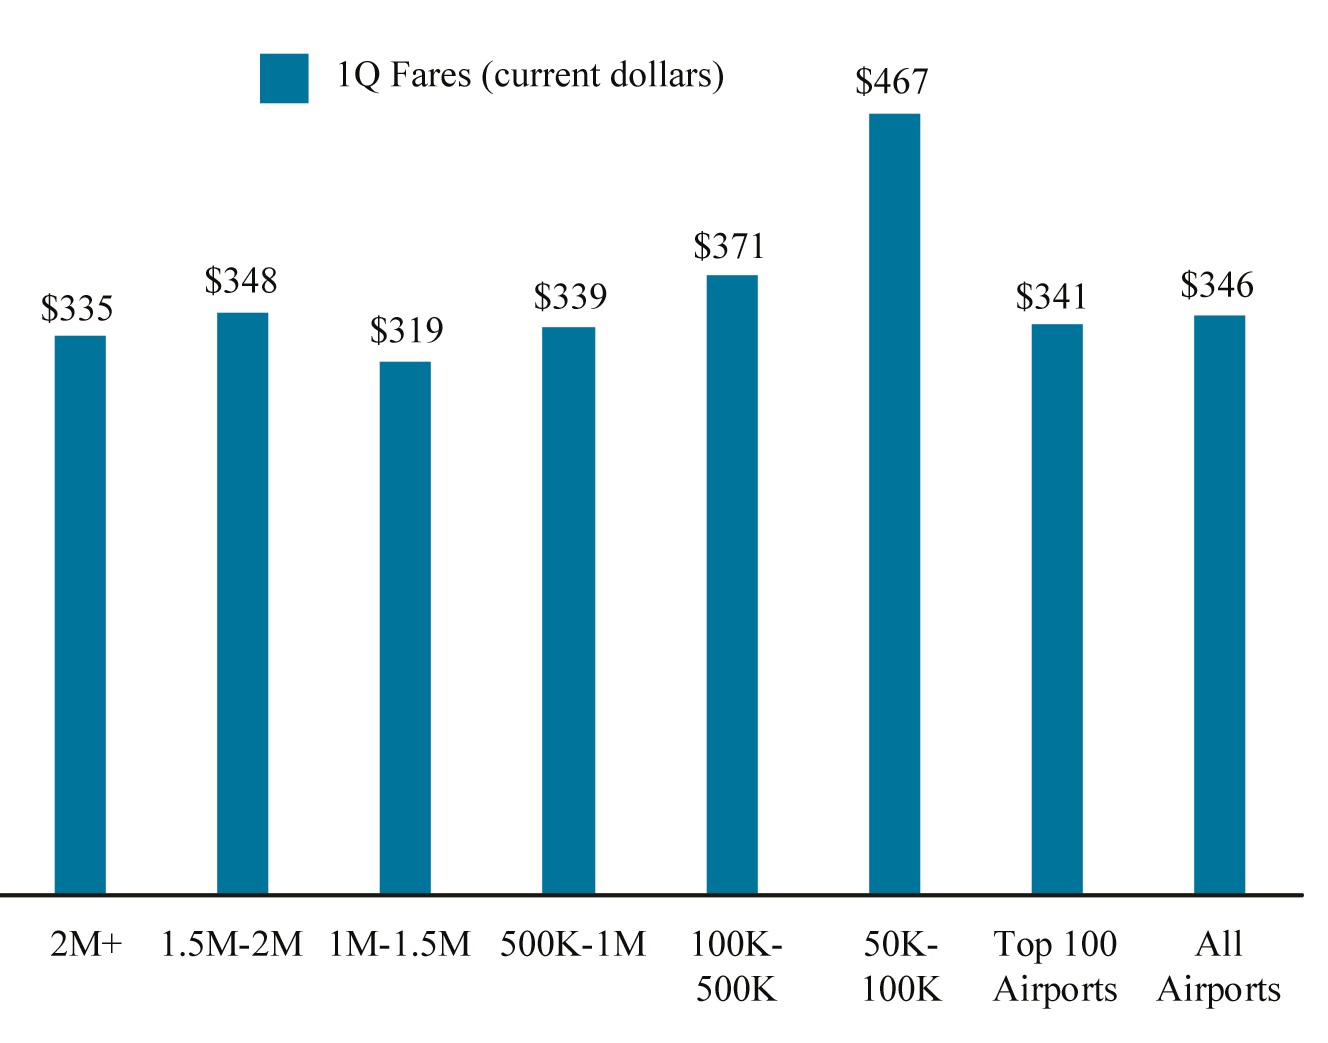
Dataset Table:
| Originating Domestic Passengers | 1Q Fares (current dollars) |
|---|---|
| 2M+ | 335 |
| 1.5M-2M | 348 |
| 1M-1.5M | 319 |
| 500K-1M | 339 |
| 100K-500K | 371 |
| 50K-100K | 467 |
| Top 100 Airports | 341 |
| All Airports | 346 |
Source:
Bureau of Transportation Statistics, Origin and Destination Survey