
Figure 2. Freight TSI modal data changes since the recession, June 2009 - December 2016
Figure
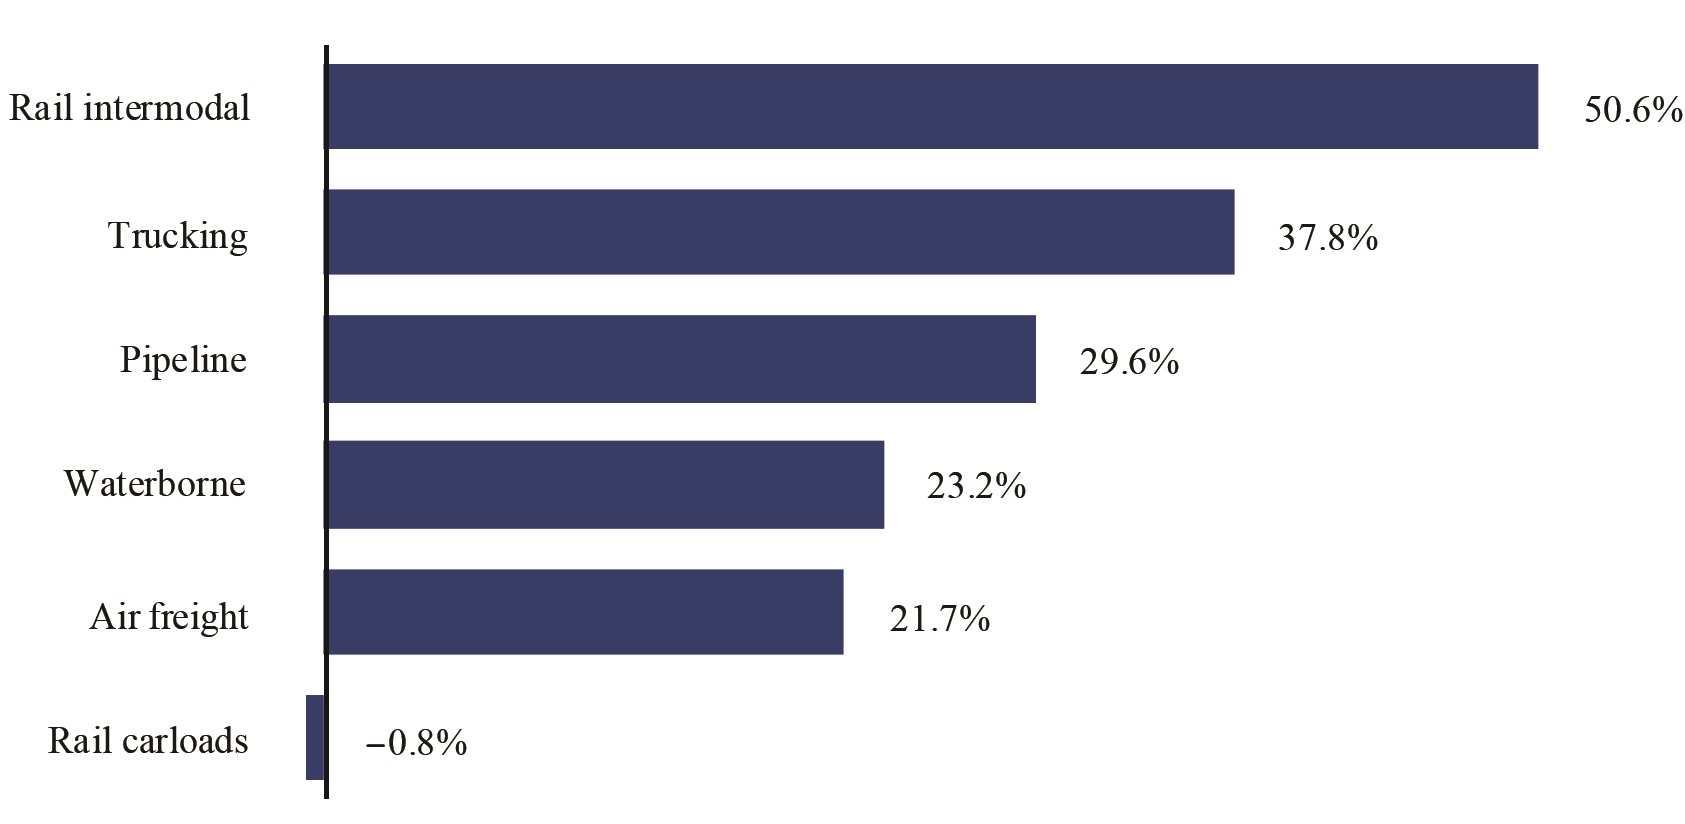
Dataset Table:
| Date | Rail Intermodal | Trucking | Pipeline | Waterborne | Air Freight | Rail Carloads |
|---|---|---|---|---|---|---|
| June 2009 through December 2016 change | 50.6% | 37.8% | 29.6% | 23.2% | 21.7% | -0.8% |
Source:
U.S. Department of Transportation, Bureau of Transportation Statistics, seasonally adjusted transportation data, available at www.bts.gov