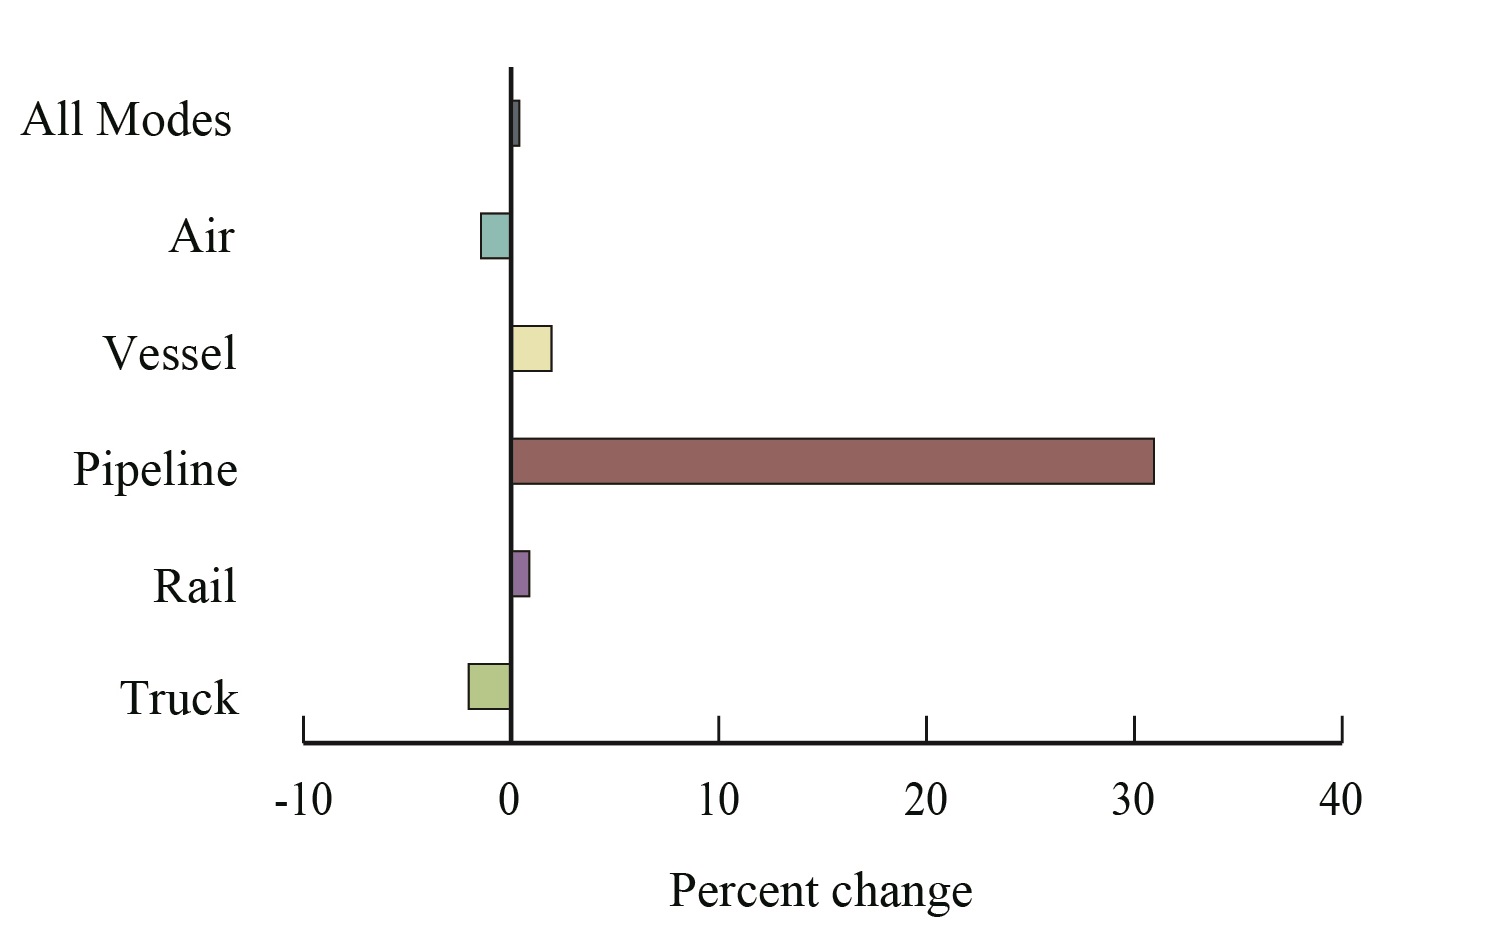
Figure 2. Percent Change in Value of U.S.-NAFTA Freight Flows by Mode: December 2015-2016
Figure
Dataset Table:
| Mode | Percent Change |
|---|---|
| Truck | -2.0 |
| Rail | 0.9 |
| Pipeline | 30.9 |
| Vessel | 2.0 |
| Air | -1.4 |
| All Modes | 0.4 |

An official website of the United States government
Official websites use .gov
A .gov website belongs to an official government organization in the United States.
Secure .gov websites use HTTPS
A lock ( ) or https:// means you’ve safely connected to the .gov website. Share sensitive information only on official, secure websites.