
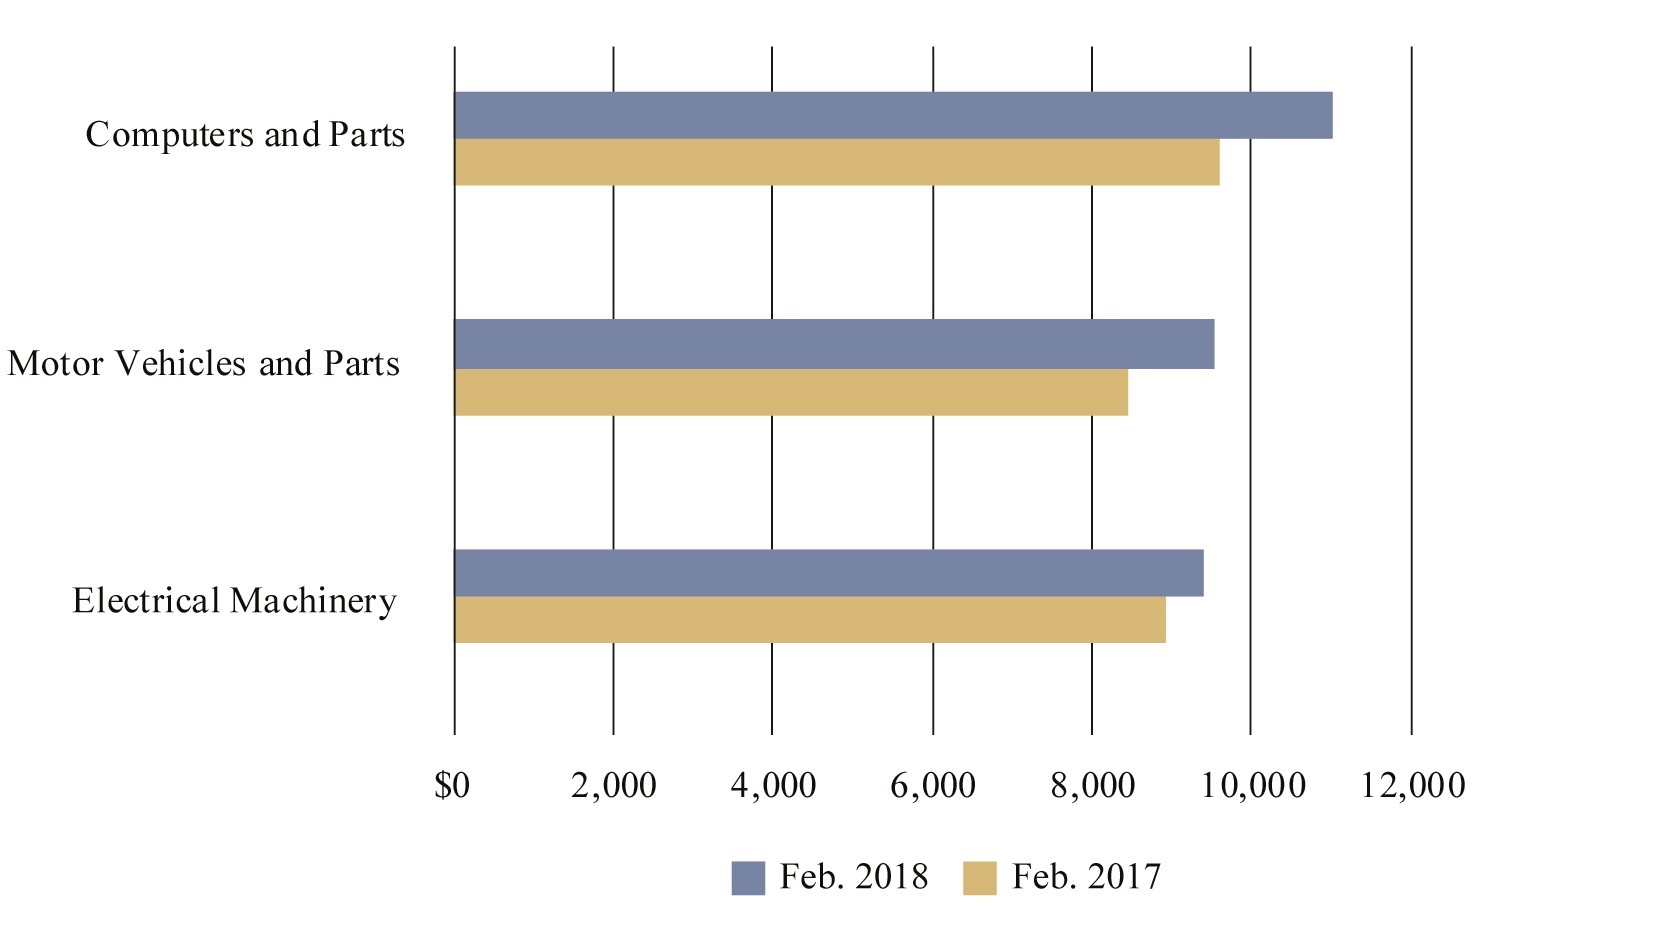
Figure 2: Top 3 Commodities by Truck, February 2018
(Dollars in Millions)
Figure
Dataset Table:
| Commodities | Feb. 2017 | Feb. 2018 |
|---|---|---|
| Electrical Machinery | 8,925 | 9,393 |
| Motor Vehicles and Parts | 8,443 | 9,517 |
| Computers and Parts | 9,591 | 11,018 |
Source:
Bureau of Transportation Statistics, TransBorder Freight Data, https://www.bts.gov/transborder