
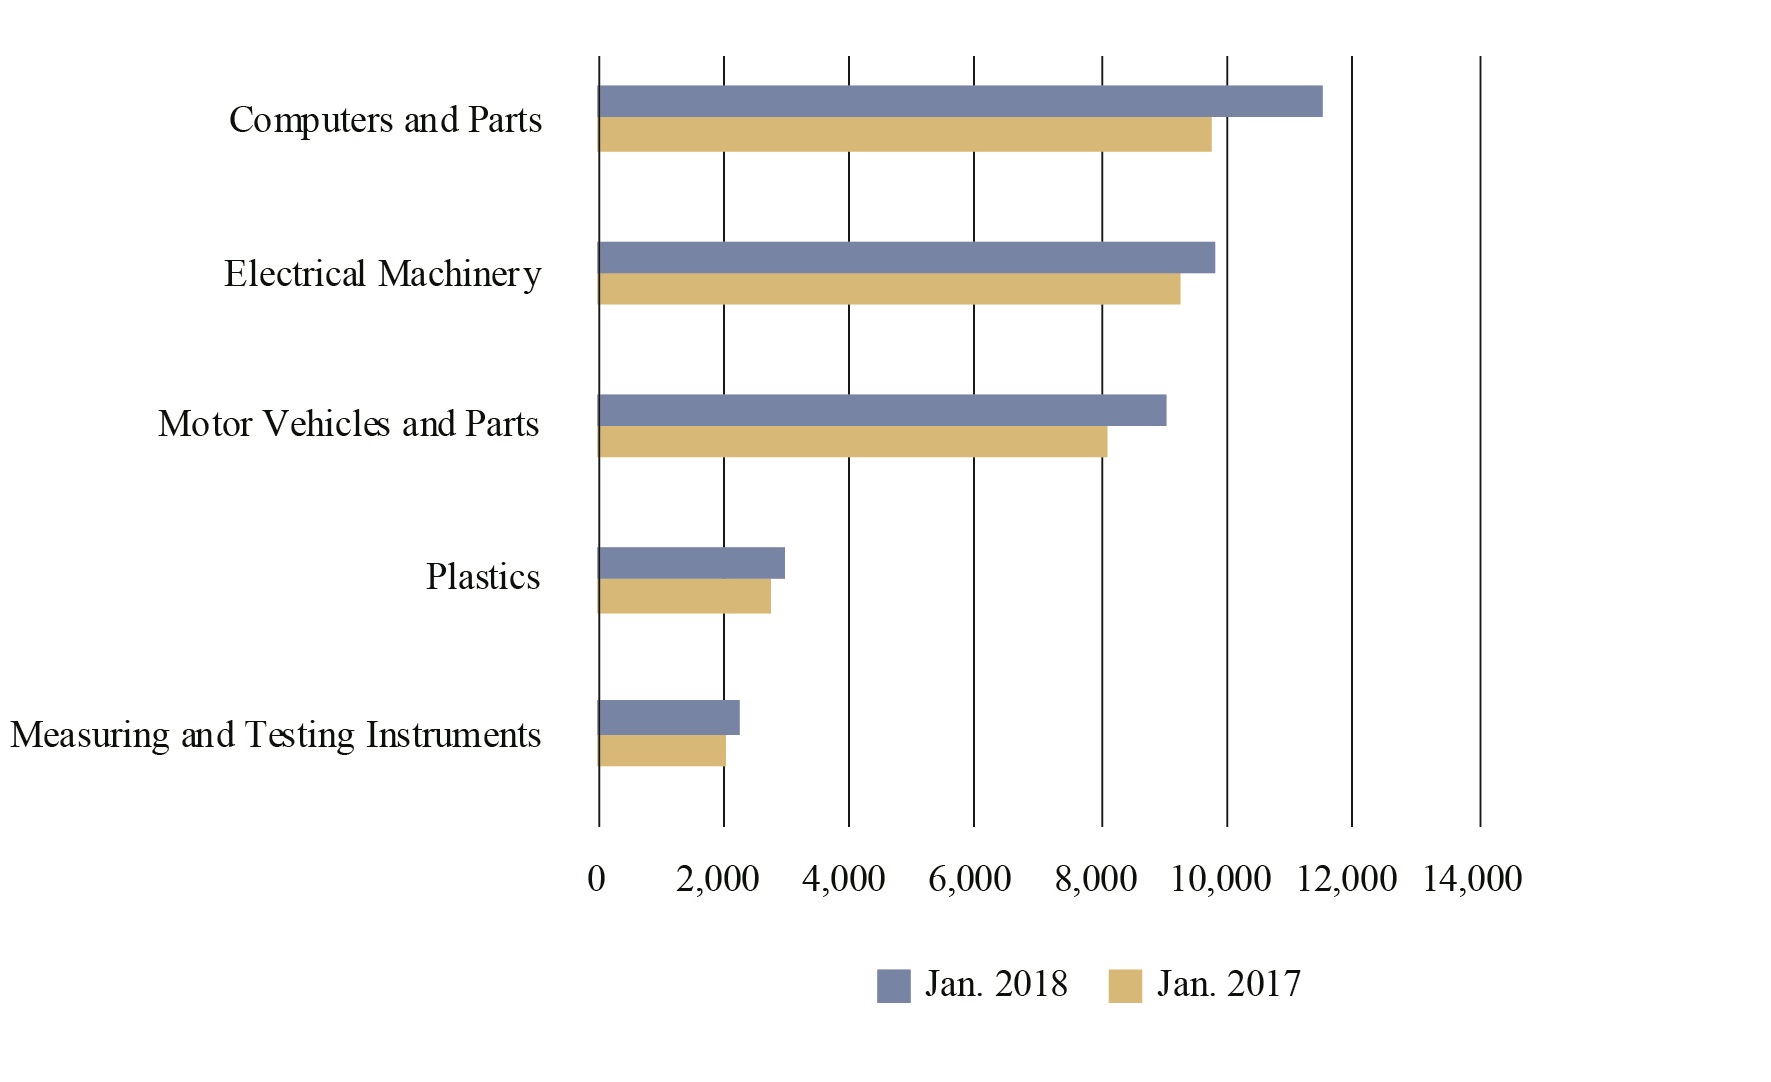
Figure 2 - Top 5 Commodities by Truck, January 2018
(Dollars in Millions)
Figure
Dataset Table:
| Commodities | Jan. 2017 | Jan. 2018 |
|---|---|---|
| Measuring and Testing Instruments | 2,031 | 2,271 |
| Plastics | 2,724 | 2,950 |
| Motor Vehicles and Parts | 8,089 | 9,024 |
| Electrical Machinery | 9,236 | 9,795 |
| Computers and Parts | 9,760 | 11,514 |
Notes:
Bureau of Transportation Statistics, TransBorder Freight Data, https://www.bts.gov/transborder