
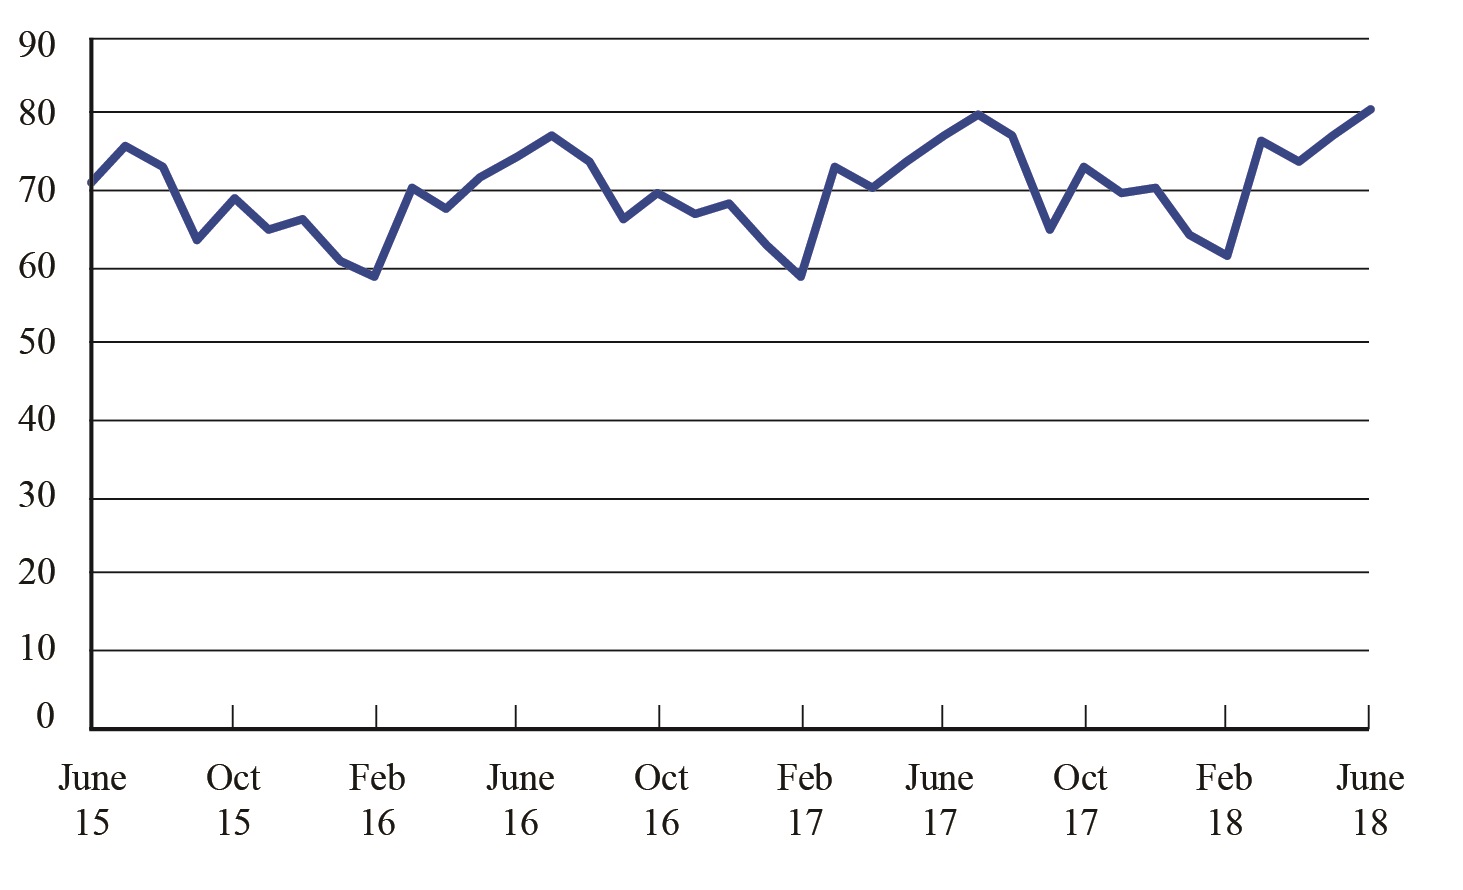
Figure 2. Unadjusted Systemwide Passenger Enplanements on All U.S. Scheduled Airlines (Domestic & International), June 2015 - June 2018
Enplanements in millions (Unadjusted)
Figure
Dataset Table:
| Enplanements in millions (Unadjusted) | 1 | ||||
|---|---|---|---|---|---|
| Jun-15 | 71.3 | 2 | |||
| Jul-15 | 75.6 | 3 | |||
| Aug-15 | 72.9 | 4 | |||
| Sep-15 | 63.7 | 5 |