
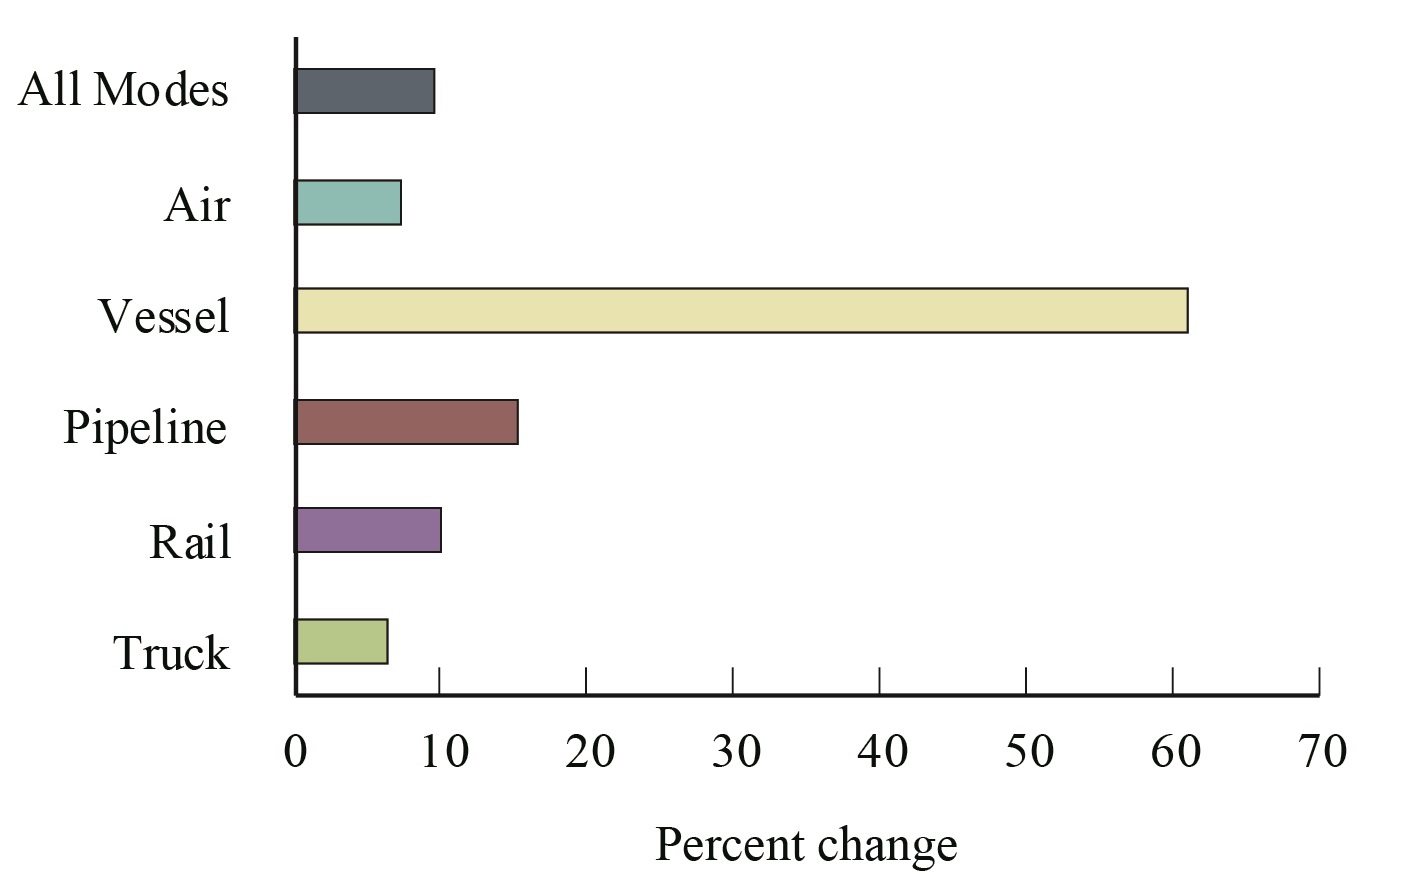
Figure 3. Percent Change in Value of U.S.-Canada Freight Flows by Mode: December 2016-2017
Figure
Dataset Table:
| Mode | Percent Change |
|---|---|
| Truck | 6.4 |
| Rail | 10.1 |
| Pipeline | 15.3 |
| Vessel | 61.1 |
| Air | 7.2 |
| All Modes | 9.5 |
Source:
Bureau of Transportation Statistics, TransBorder Freight Data, https://www.bts.gov/transborder