
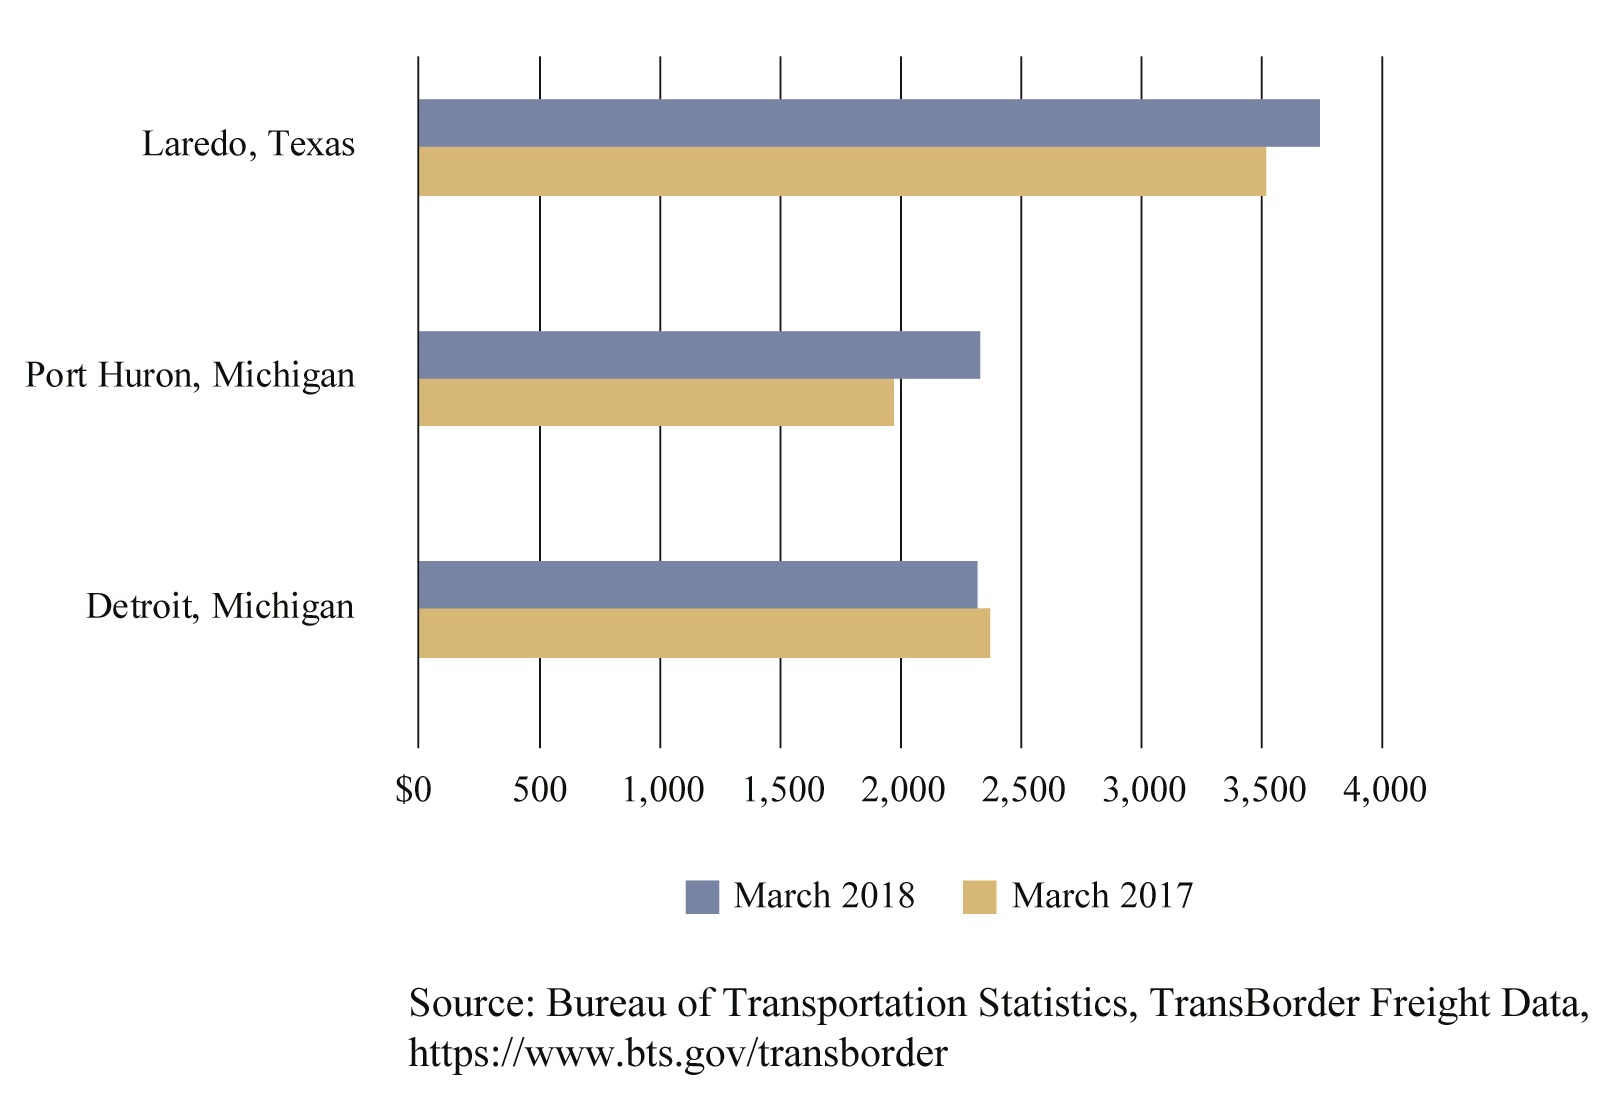
Figure 3: Top 3 U.S. Ports by Rail
(Dollars in Millions)
Figure
Dataset Table:
| Port of Entry/Exit | Mar. 2017 | Mar. 2018 |
|---|---|---|
| Detroit, Michigan | 2,372 | 2,318 |
| Port Huron, Michigan | 1,972 | 2,333 |
| Laredo, Texas | 3,516 | 3,739 |
Source:
Bureau of Transportation Statistics, TransBorder Freight Data, https://www.bts.gov/transborder