
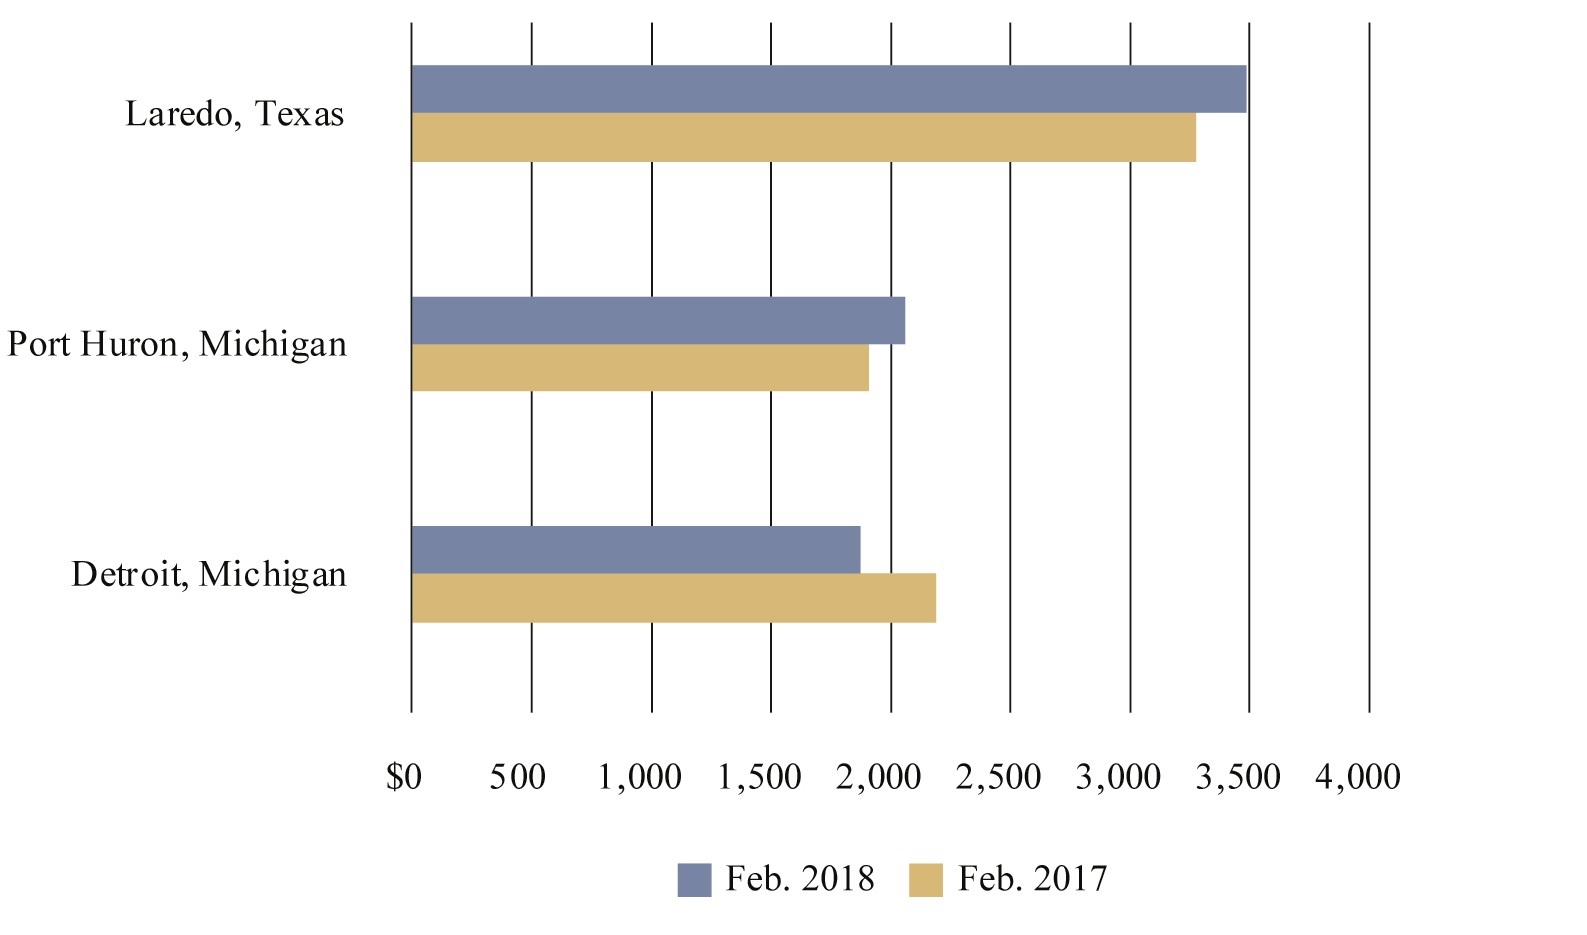
Figure 3: Top 3 U.S. Ports by Rail, February 2018
(Dollars in Millions)
Figure
Dataset Table:
| Port of Entry/Exit | Feb. 2017 | Feb. 2018 |
|---|---|---|
| Detroit, Michigan | 2,191 | 1,871 |
| Port Huron, Michigan | 1,907 | 2,061 |
| Laredo, Texas | 3,274 | 3,487 |
Source:
Bureau of Transportation Statistics, TransBorder Freight Data, https://www.bts.gov/transborder