
Figure 3. Unadjusted December Systemwide Passenger Enplanements on All U.S. Scheduled Airlines (Domestic & International), 2003 - 2017
Enplanements in millions (Unadjusted)
Figure
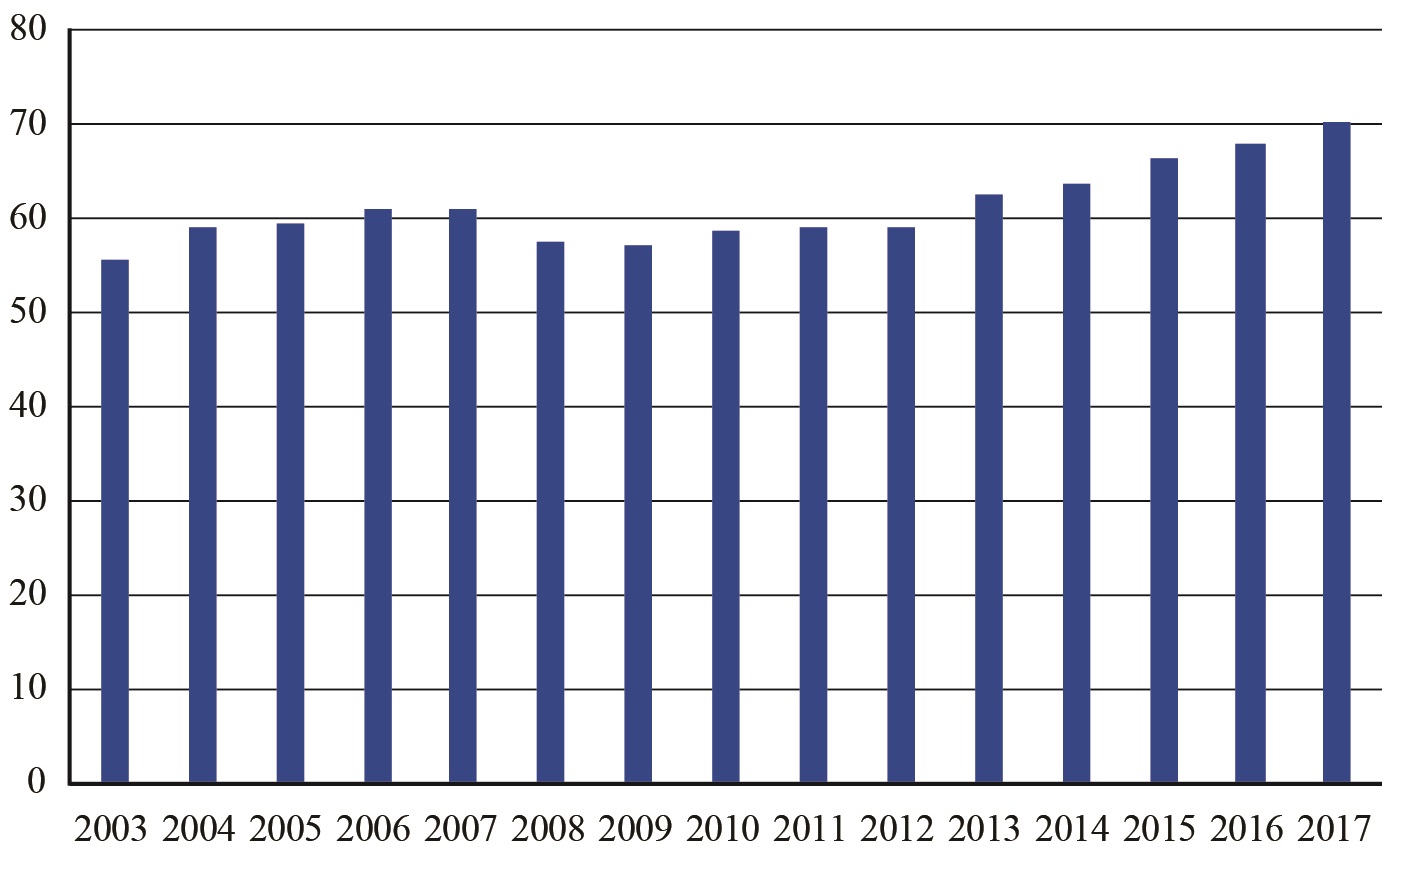
Dataset Table:
| Enplanements in millions (Unadjusted) | |
|---|---|
| 2003 | 55.4 |
| 2004 | 59.0 |
| 2005 | 59.5 |
| 2006 | 60.7 |
| 2007 | 60.8 |
| 2008 | 57.4 |
| 2009 | 56.9 |
| 2010 | 58.6 |
| 2011 | 59.1 |
| 2012 | 58.9 |
| 2013 | 62.5 |
| 2014 | 63.8 |
| 2015 | 66.4 |
| 2016 | 68.0 |
| 2017 | 70.2 |