
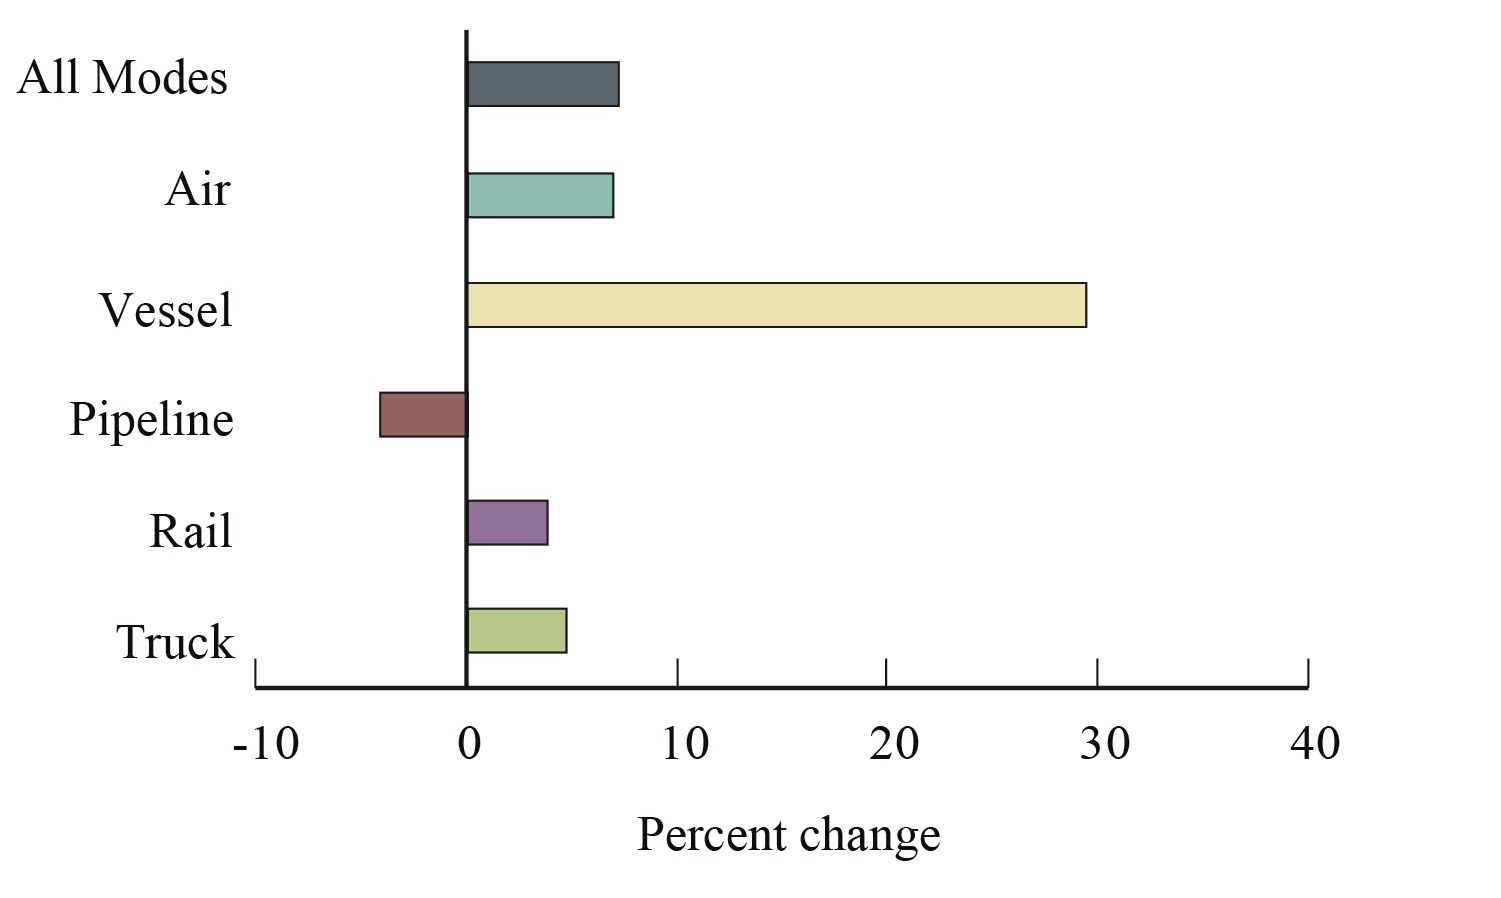
Figure 4. Percent Change in Value of U.S.-Mexico Freight Flows by Mode: May 2016-2017
Figure
Dataset Table:
| Figure 4. Percent Change in Value of U.S.-Mexico Freight Flows by Mode: May 2016-2017 | |
|---|---|
| Mode | Percent Change |
| Truck | 4.8 |
| Rail | 3.8 |
| Pipeline | -4.1 |
| Vessel | 29.5 |
| Air | 7.0 |
| All Modes | 7.2 |
Source:
Bureau of Transportation Statistics, TransBorder Freight Data, https://data.bts.gov/stories/s/myhq-rm6q