
Figure 4: Top 3 Commodities by Rail, February 2018
(Dollars in Millions)
Figure
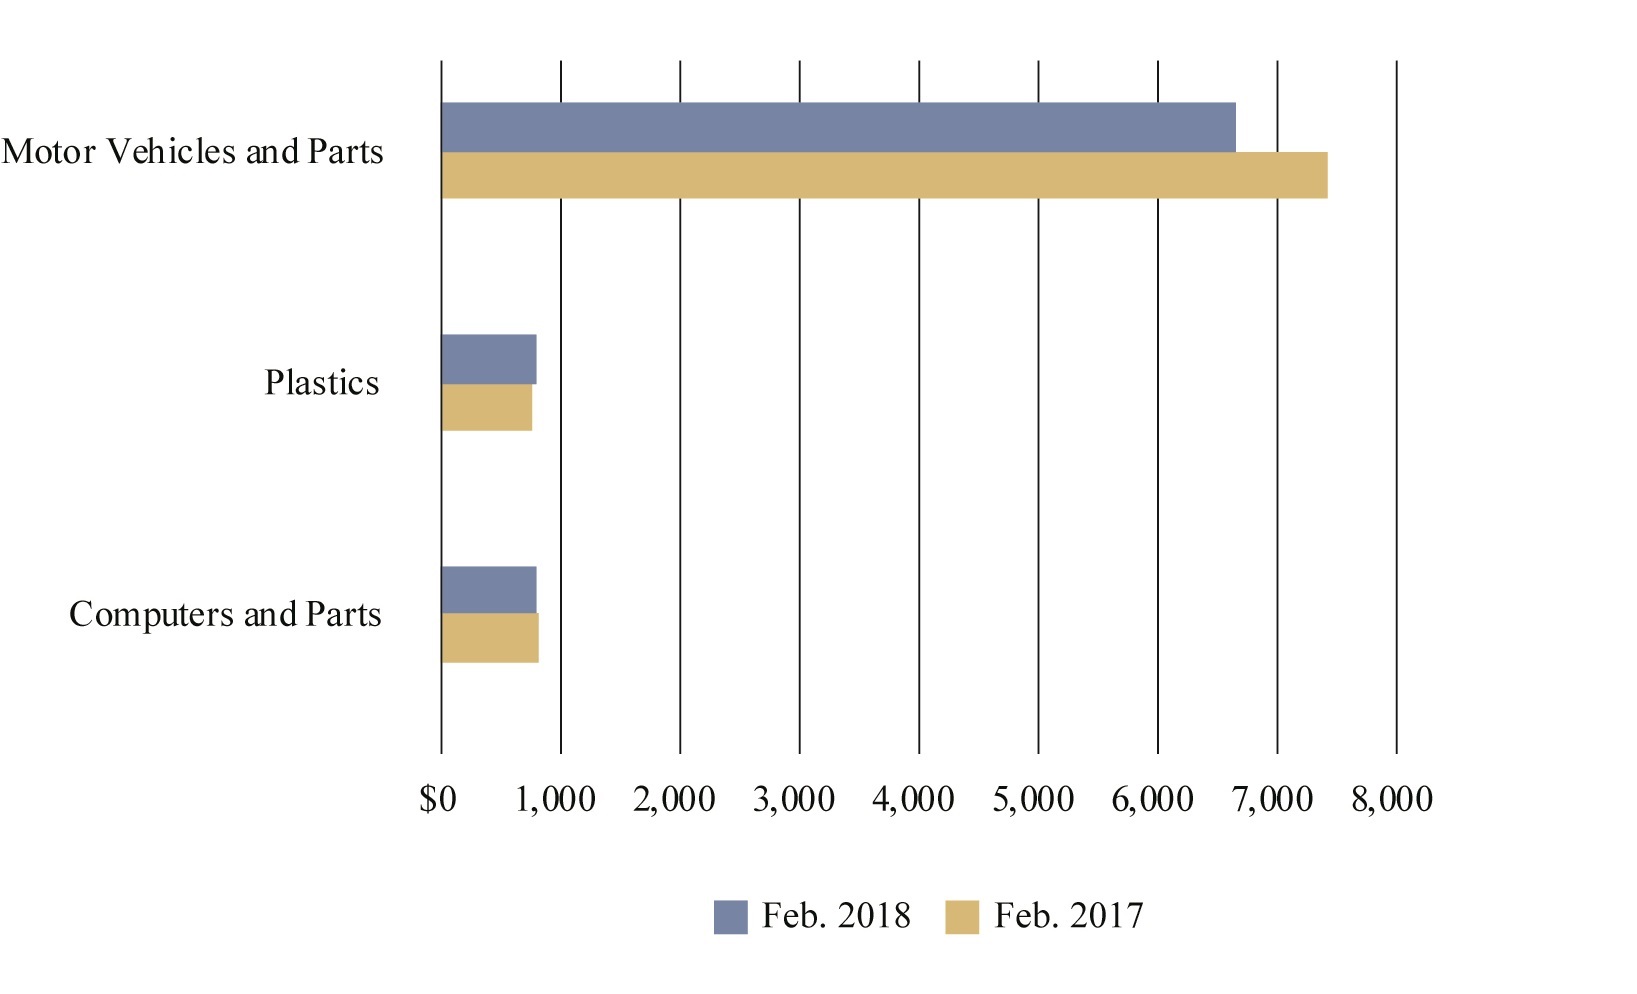
Dataset Table:
| Commodities | Feb. 2017 | Feb. 2018 |
|---|---|---|
| Computers and Parts | 811 | 788 |
| Plastics | 754 | 799 |
| Motor Vehicles and Parts | 7,403 | 6,645 |
Source:
Bureau of Transportation Statistics, TransBorder Freight Data, https://www.bts.gov/transborder