
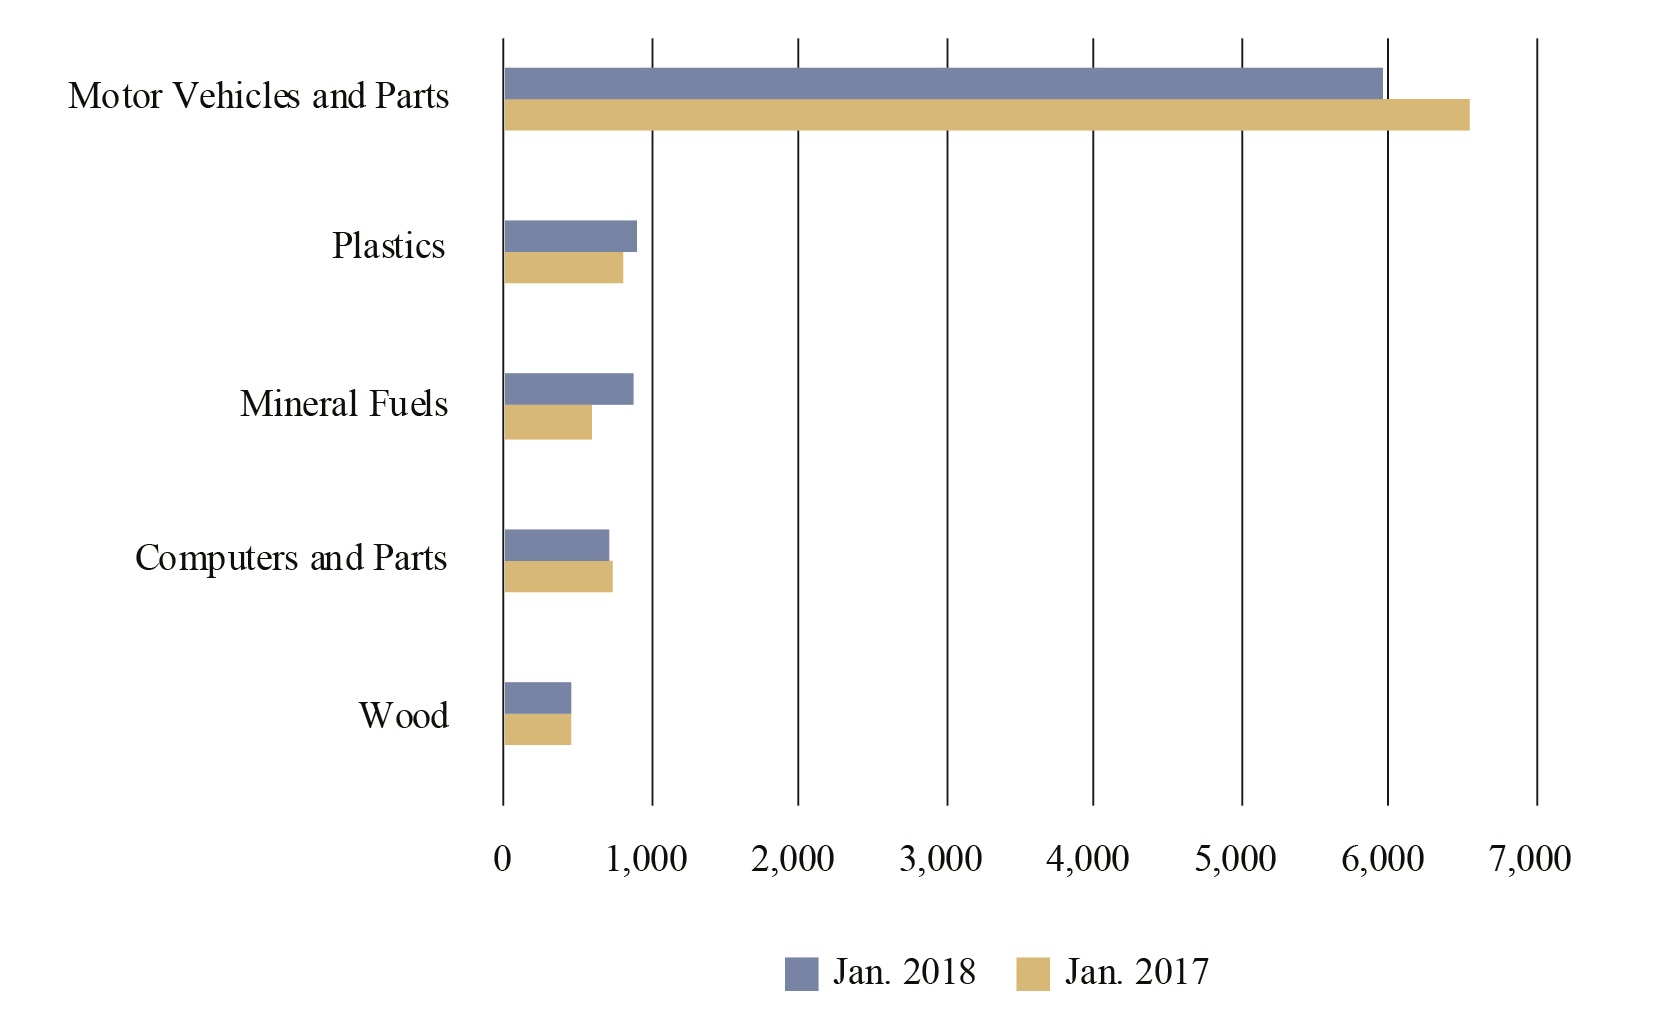
Figure 4 - Top 5 Commodities by Rail, January 2018
(Dollars in Millions)
Figure
Dataset Table:
| Commodities | Jan. 2017 | Jan. 2018 |
|---|---|---|
| Wood | 454 | 450 |
| Computers and Parts | 733 | 709 |
| Mineral Fuels | 591 | 872 |
| Plastics | 807 | 915 |
| Motor Vehicles and Parts | 6,545 | 5,956 |
Notes:
Bureau of Transportation Statistics, TransBorder Freight Data, https://www.bts.gov/transborder