
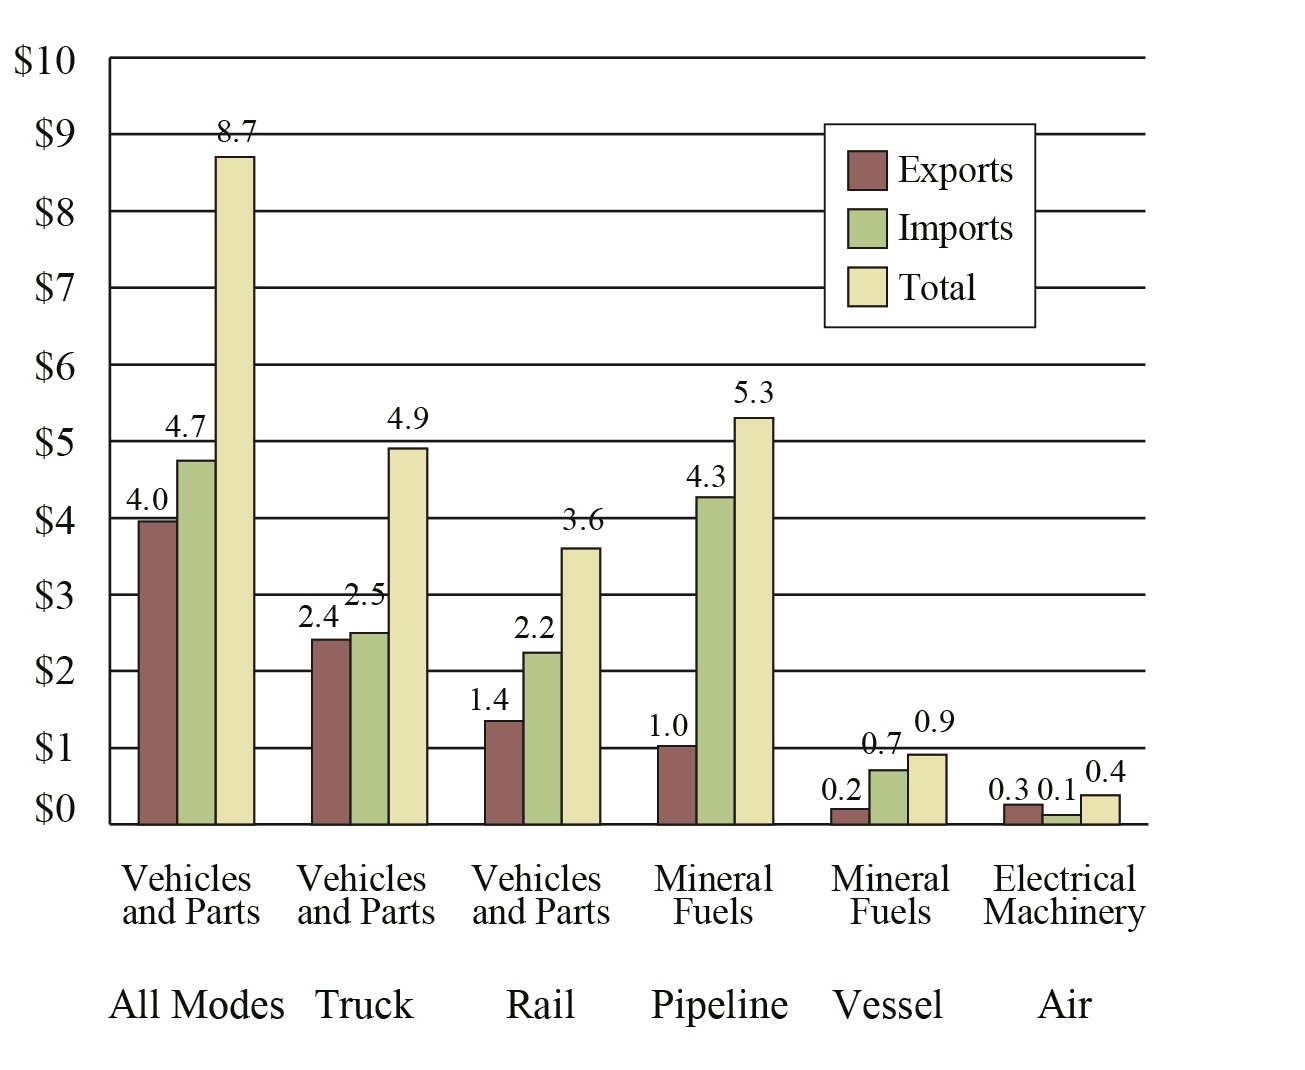
Figure 5. Top Commodity Transported between the U.S. and Canada for Each Mode of Transportation, February 2017
(billions of current dollars)
Figure
Dataset Table:
| Mode | Commodities | Exports | Imports | Total |
|---|---|---|---|---|
| All Modes | Vehicles and Parts | 4.0 | 4.7 | 8.7 |
| Truck | Vehicles and Parts | 2.4 | 2.5 | 4.9 |
| Rail | Vehicles and Parts | 1.4 | 2.2 | 3.6 |
| Pipeline | Mineral Fuels | 1.0 | 4.3 | 5.3 |
| Vessel | Mineral Fuels | 0.2 | 0.7 | 0.9 |
| Air | Electrical Machinery | 0.3 | 0.1 | 0.4 |
Notes:
Numbers might not add to totals due to rounding.
Source:
Bureau of Transportation Statistics, TransBorder Freight Data, https://data.bts.gov/stories/s/myhq-rm6q