
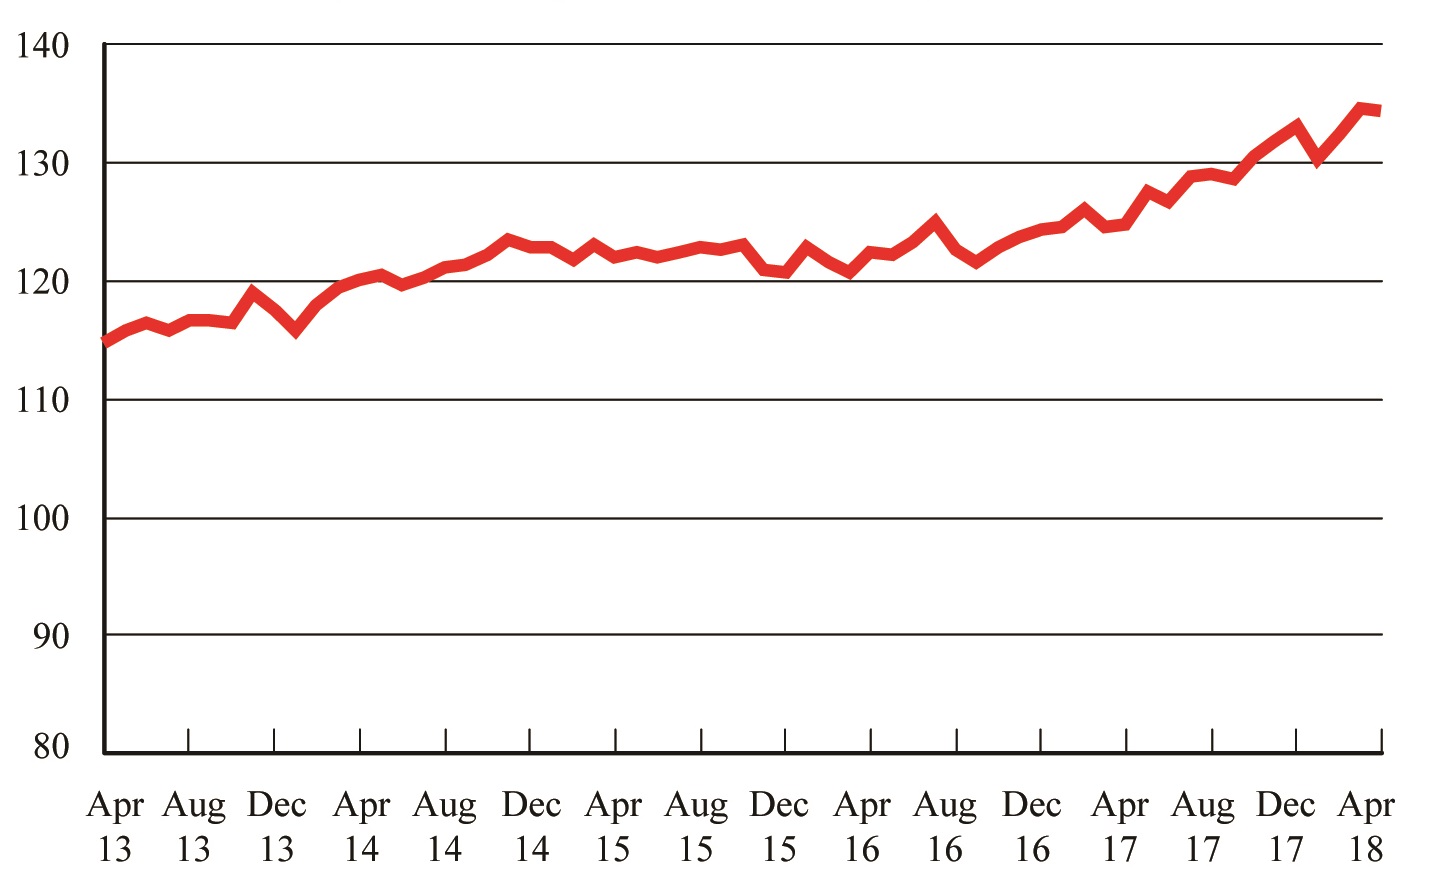
Freight Transportation Services Index, April 2013 - April 2018
(Seasonally Adjusted, Monthly Average of 2000 = 100)
Figure
Dataset Table:
| Month | Freight TSI | |||
|---|---|---|---|---|
| Apr-13 | 114.7 | |||
| May-13 | 115.9 | |||
| Jun-13 | 116.4 | |||
| Jul-13 | 115.9 |
Source:
Bureau of Transportation Statistics